
Modern cloud applications are highly services-driven and leverage a lot of APIs including external APIs such as Twitter Auth API, Twilio API, Google Maps API, and various PaaS APIs. In a previous blog post, we had talked about the shift from monolithic architectures to microservices and the implications of that change from an operational perspective for Site Reliability Engineers (SREs) and DevOps engineers.
In this blog post, we focus on the golden signals of monitoring that are the foundation of service-level observability for large-scale production applications. These golden signals ultimately help measure end-user experience, service abandonment and impact on business. After discussing these signals, we describe how we have approached their measurement in a way that is fundamentally different from the existing approaches that primarily require code-embedded agents or instrumentation of code.
The Four Golden Signals
The four golden signals of monitoring are latency, traffic, errors, and saturation. These have been championed by the Google SRE team and the larger web-scale SRE community as the most fundamental metrics for tracking service health and performance.
Here is a brief description of these four golden signals:
- Latency: The time it takes to service a request, with a focus on distinguishing between the latency of successful requests and the latency of failed requests.
- Traffic: A measure of how much demand is being placed on the service. This is measured using a high-level service-specific metric, like HTTP requests per second in the case of an HTTP REST API.
- Errors: The rate of requests that fail. The failures can be explicit (e.g., HTTP 500 errors) or implicit (e.g., an HTTP 200 OK response with a response body having too few items).
- Saturation: How “full” is the service. This is a measure of the system utilization, emphasizing the resources that are most constrained (e.g., memory, I/O or CPU). Services degrade in performance as they approach high saturation.
By focusing their monitoring and alerting on these golden signals, SREs and DevOps can effectively support the Service Level Objectives (SLOs) for the services and APIs that make up their production applications.
Netsil’s Approach to Observability and Analytics
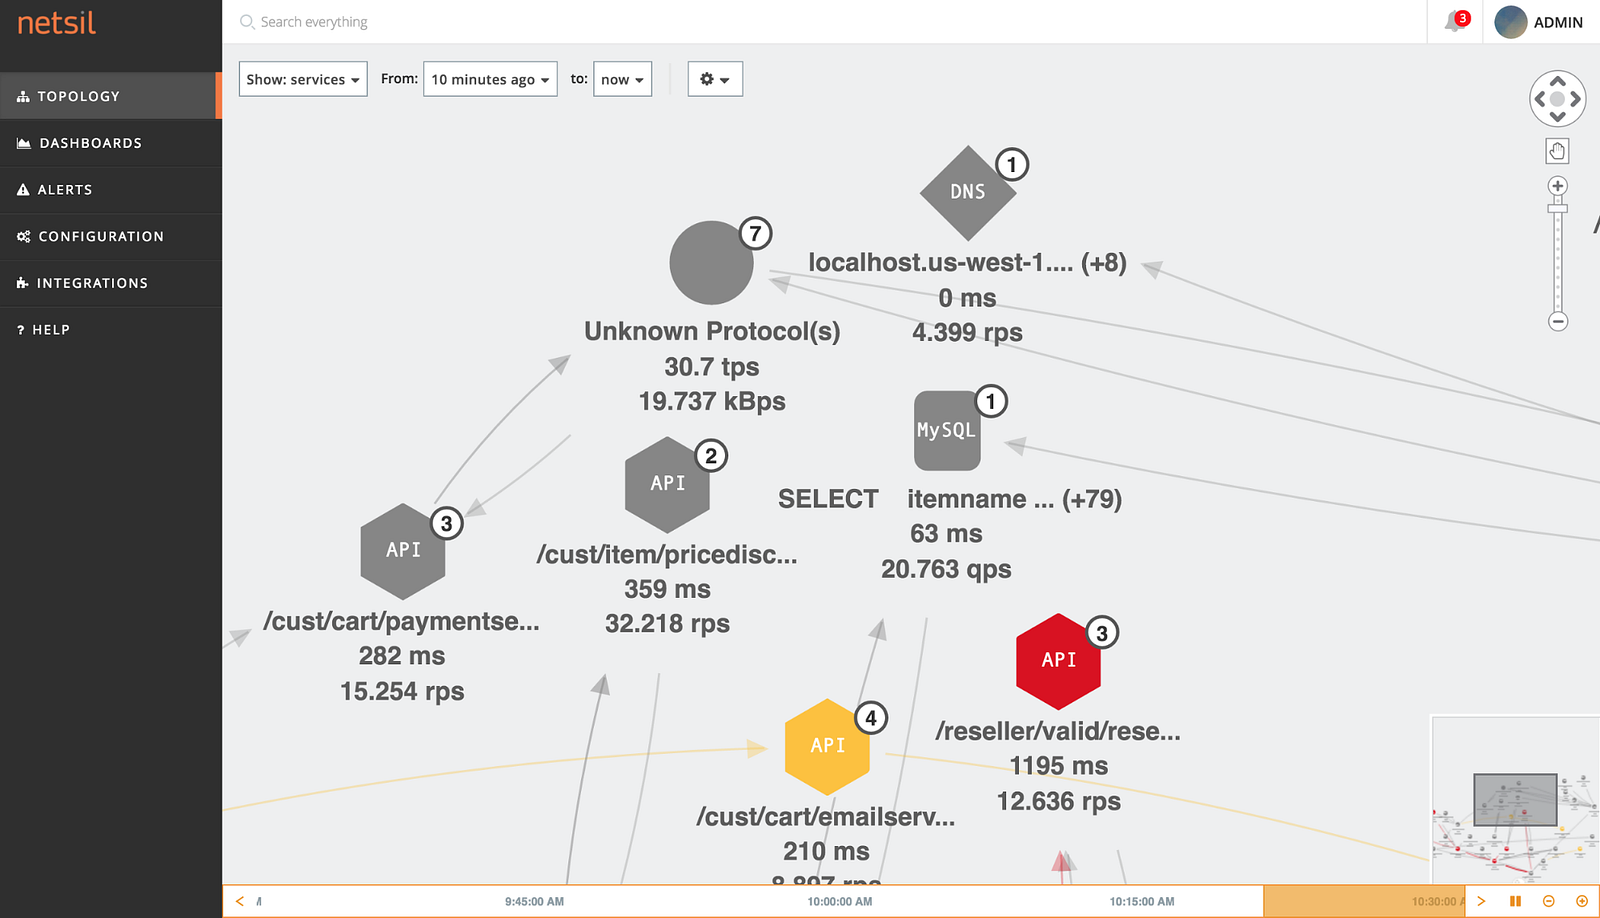
The Netsil Application Operations Center (AOC) is an observability and analytics product used by SREs and DevOps who run API and services driven cloud applications.
While the programming languages and web frameworks used to build the services change frequently with time, service communication protocols such as HTTP remain relatively constant, acting as the glue between them. Leveraging this insight, Netsil captures service interactions in real-time as its source-of-truth, without instrumenting the application code. Netsil’s specialized stream-processing technology analyzes these interactions and automatically discovers the service topology map of the application, overlaying it with operational metrics (including the golden signals). A previous blog post covered our architecture in more detail.
Code-based application monitoring tools require upfront investment in the form of instrumentation of code before they can provide value. Further, they do not give visibility into calls made to external APIs as they cannot instrument them. The Netsil approach works seamlessly for both internal and external APIs, and the lack of upfront investment leads to fastest time-to-value.
Latency, Traffic and Errors Tracked Based On Service-Level KPIs
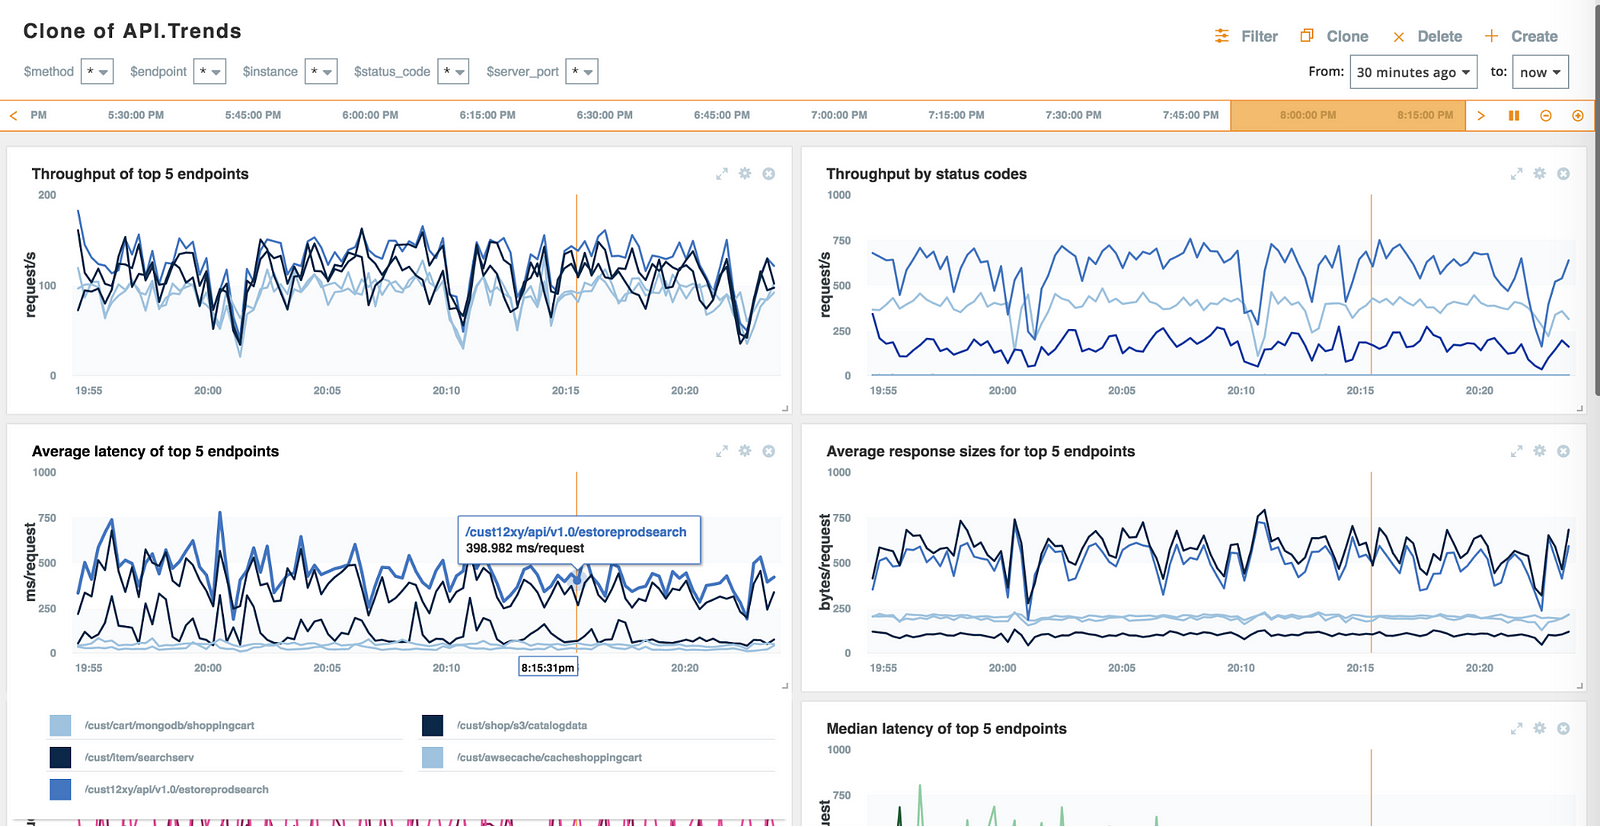
The service-level KPIs tracked by Netsil include the golden signals of latency, traffic and errors. Let’s take the example of HTTP REST APIs. Each signal is tracked at the granularity of individual REST endpoints, which are automatically discovered from service interactions. Here is how Netsil measures them:
- Latency: The AOC monitors latency for each API call by observing requests by clients on individual endpoints and responses sent back by servers. Simply measuring latency at endpoint-level is not as informational as it may lead to misleading conclusions about API health. Netsil allows users to drill-down further by distinguishing between latencies across different server response codes. For example, an HTTP 500 error that fails fast is better than a slow error. Similarly, a delayed HTTP 200 OK response may be considered an error in some cases. Drilling-down further into the latency of an HTTP 500 error versus the latency of an HTTP 200 OK response gives greater visibility into this signal.
- Traffic: Traffic (or throughput) is measured as the number of requests per second (RPS) served (broken down by REST endpoints, in our example). With the AOC you can slice and dice throughput further by status codes, hosts, request types and even the request/response body content.
- Errors: Netsil monitors the error rates, or the rate of request failures, by explicitly tracking the server response codes. However, sometimes the server response codes alone may not be sufficient to identify failures. In such cases, errors can be identified using other metrics. For e.g., a malformed request for a search API might return no responses. Let’s say the average response size is 500KB but the size for the response to a malformed request is only 2KB (along with a response code of 200 OK). Then the error can be identified by monitoring the size of the responses for anomalies.
Saturation Tracked Based on Network & Infrastructure KPIs
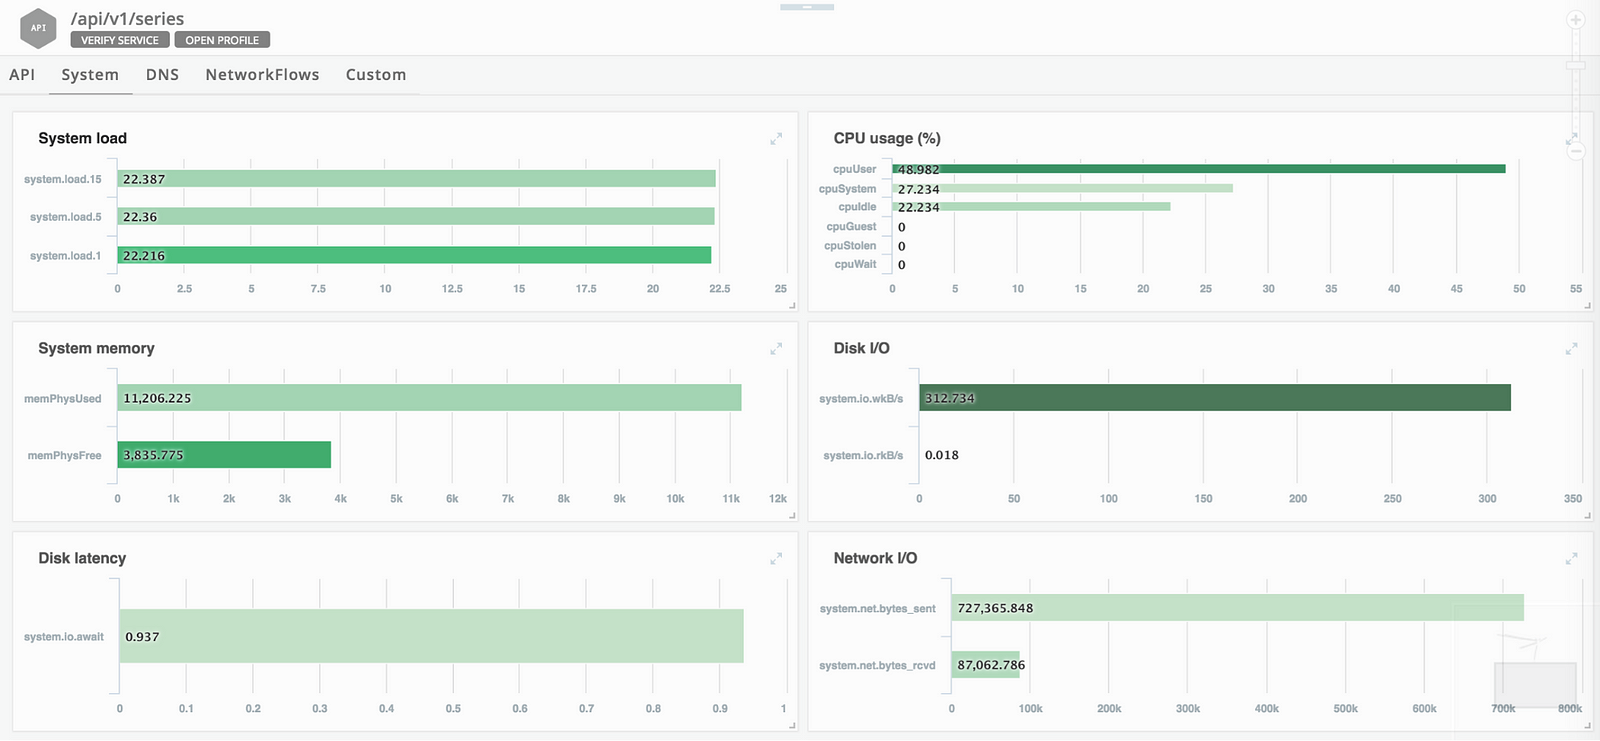
Many application health issues are rooted in problems related to the underlying network or infrastructure. These include issues being experienced by the cloud provider. Out of the golden signals, Saturation is a signal which is related to the underlying infrastructure. Saturation is measured by looking at infrastructure metrics such as Disk I/O, Network I/O and System Memory.
Figure 3 shows these infrastructure metrics being tracked in the Netsil AOC.
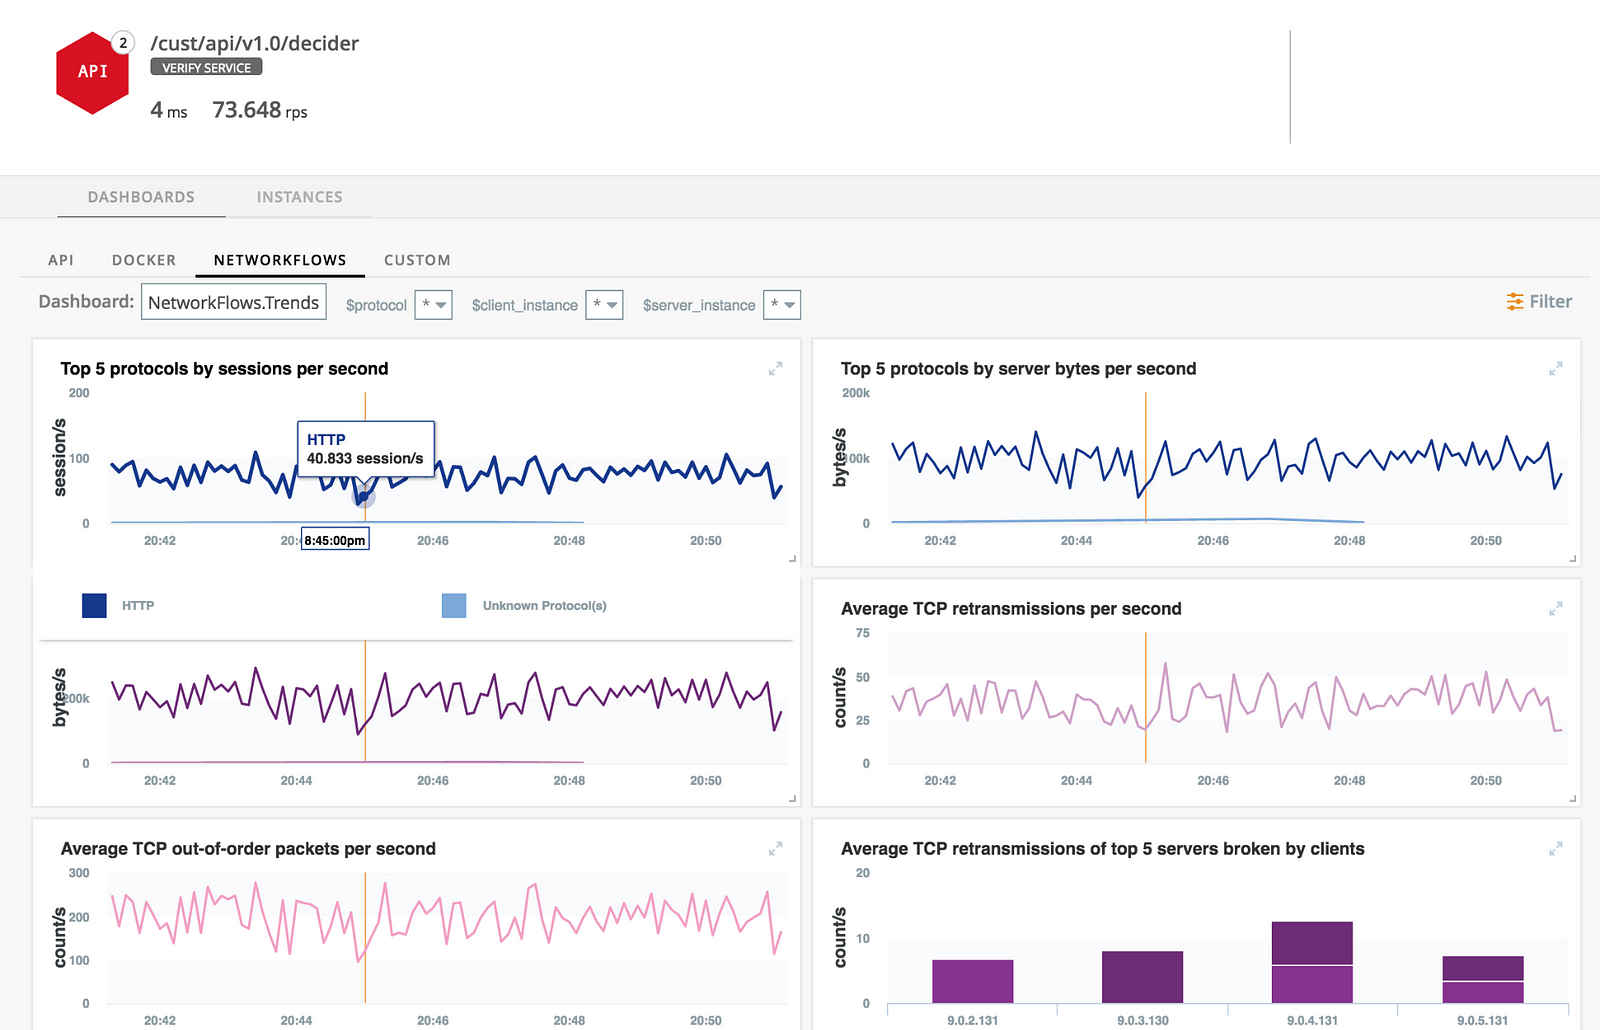
The AOC also allows you to look at network flows including TCP retransmission rates, connection drops, round-trip-times and out-of-order packet counts. If your cloud provider is having issues (say a networking issue in the datacenter or VMs being overloaded), network packets will start getting dropped. By tracking the average TCP retransmissions per second and TCP out-of-order packets per second, you can quickly identify this issue. Figure 4 shows how network flows are presented in the AOC.
Bringing It All Together
In conclusion, the Netsil AOC is built from ground-up for powering observability and analytics in modern cloud applications that use APIs and services. The product brings together service-level KPIs and infrastructure metrics in a way that allows SREs and DevOps to efficiently measure the four golden signals of API health and performance. Further, the Netsil approach of using service interactions as the source-of-truth rather than code instrumentation allows seamless monitoring across internal & external APIs and fastest time-to-value.
We welcome your comments on this post and also encourage you to try the Netsil AOC at https://netsil.com/.