

Nutanix publishes information for initiatives that help customers integrate the Nutanix platform with other third-party products. Support for these initiatives is handled via the Nutanix community on a best-effort basis. Where open source products are referenced, support is typically provided via GitHub issues in the referenced repositories.
This feature is now directly available in recent NKE (Karbon) versions with the built-in Monitoring Prometheus stack.
Introduction
At Nutanix, we continue to see new and current customers take advantage of Karbon to rapidly configure and deploy Kubernetes clusters as they progress in their cloud native journeys.
Karbon, an integrated component of Nutanix AOS, is a solution that enables IT operators to deliver and manage end-to-end, production-ready Kubernetes environments with push-button simplicity, all while preserving a native user experience.
In Kubernetes, resource usage metrics, such as container CPU and memory usage, are made available through the Metrics API. These metrics can be accessed either directly by the user with the kubectl top command, or utilized by a controller in the cluster, for example the Horizontal Pod Autoscaler or Vertical Pod Autoscaler, to make decisions.
There is no built-in choice inside Kubernetes to collect and expose these metrics. In many kubernetes installations this task is assigned to the metrics-server component. This component collects resource metrics from Kubelets and exposes them in Kubernetes apiserver through the Metrics API.
But there are alternatives, some of which are much more powerful. In this article we will see how to install the Prometheus Adapter to expose this famous Metrics API. This project is an implementation of the Kubernetes resource metrics, custom metrics, and external metrics APIs. This adapter is therefore suitable for use with the autoscaling/v2 Horizontal Pod Autoscaler in Kubernetes 1.6+ and also replaces the metrics server on clusters that already run Prometheus and collect the appropriate metrics.
What we’re going to do
This blog offers a step-by-step guide on how to activate Metrics API inside any Karbon Kubernetes cluster by leveraging the Prometheus Adapter. We’re going to
- Verify prerequisites
- Prepare the Prometheus Adapter Helm configuration file
- Install the Prometheus Adapter
- Test the Metrics API
- Bonus: add an additional security layer
Verify the prerequisites
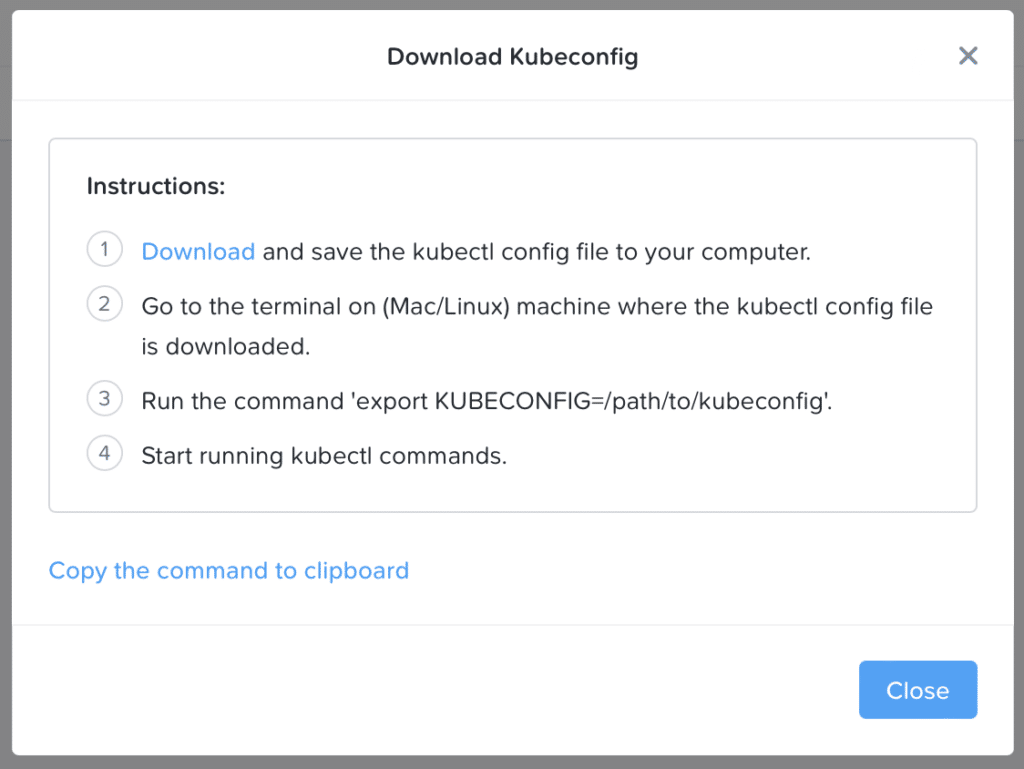
In order to follow this guide, you need a freshly deployed Karbon Kubernetes cluster. Once the cluster is deployed you’ll download the kubeconfig admin file and install it on your workstation. This can be done from the Prism graphical interface or with the excellent karbon kubectl plugin
## Download and install your kubeconfig file with the karbon plugin
kubectl karbon login --cluster=new

#Verify the cluster connectivity
kubectl get nodes
NAME                              STATUS   ROLES    AGE     VERSION
karbon-new-da1057-k8s-master-0    Ready    master   6h31m   v1.20.9
karbon-new-da1057-k8s-worker-0    Ready    node     6h27m   v1.20.9
karbon-new-da1057-k8s-worker-1    Ready    node     6h27m   v1.20.9
karbon-new-da1057-k8s-worker-2    Ready    node     6h27m   v1.20.9
Prepare the Prometheus Adapter Helm Configuration file
Create a prometheus-adapter-values.yaml file with the following content.
logLevel: 1

prometheus:
  url: http://prometheus-operated.ntnx-system.svc

replicas: 2

rules:
  default: true
  resource:
    cpu:
      containerQuery: sum(rate(container_cpu_usage_seconds_total{<<.LabelMatchers>>, container!=""}[5m])) by (<<.GroupBy>>)
      nodeQuery: sum(rate(container_cpu_usage_seconds_total{<<.LabelMatchers>>, id='/'}[5m])) by (<<.GroupBy>>)
      resources:
        overrides:
          node:
            resource: node
          namespace:
            resource: namespace
          pod:
            resource: pod
      containerLabel: container
    memory:
      containerQuery: sum(container_memory_working_set_bytes{<<.LabelMatchers>>, container!=""}) by (<<.GroupBy>>)
      nodeQuery: sum(container_memory_working_set_bytes{<<.LabelMatchers>>,id='/'}) by (<<.GroupBy>>)
      resources:
        overrides:
          node:
            resource: node
          namespace:
            resource: namespace
          pod:
            resource: pod
      containerLabel: container
    window: 5m
Install Prometheus Adapter
An easy way to install the Prometheus Adapter is to use the provided helm chart. You just need to run the following Helm command.
helm repo add prometheus-community https://prometheus-community.github.io/helm-charts --force-update
helm repo update
helm install -n prometheus-adapter karbon prometheus-community/prometheus-adapter --create-namespace -f prometheus-adapter-values.yaml
If all is ok, you will have the following output
NAME: karbon
LAST DEPLOYED: Wed Nov 10 17:55:07 2021
NAMESPACE: prometheus-adapter
STATUS: deployed
REVISION: 1
TEST SUITE: None
NOTES:
karbon-prometheus-adapter has been deployed.
In a few minutes you should be able to list metrics using the following command(s):

  kubectl get --raw /apis/metrics.k8s.io/v1beta1
  kubectl get --raw /apis/custom.metrics.k8s.io/v1beta1
Test the Metrics API
First, check that the deployment is up and running.
# Verify the prometheus adapter is correctly deployed
kubectl rollout status -n prometheus-adapter deploy/karbon-prometheus-adapter

deployment "karbon-prometheus-adapter" successfully rolled out

# check that all pods are up and running in the prometheus-adapter namespace
kubectl get pods -n prometheus-adapter

NAME                                         READY   STATUS    RESTARTS   AGE
karbon-prometheus-adapter-8464456d75-lhfkn   1/1     Running   0          11m
karbon-prometheus-adapter-8464456d75-svlzh   1/1     Running   0          11m
Next, let’s try to interact with the Metrics API.
# Display resource (CPU/memory) usage of nodes
kubectl top node new2-context ⎈
NAME CPU(cores) CPU% MEMORY(bytes) MEMORY%
karbon-new-da1057-k8s-master-0 306m 15% 2319Mi 69%
karbon-new-da1057-k8s-worker-0 565m 7% 2996Mi 40%
karbon-new-da1057-k8s-worker-1 406m 5% 2231Mi 30%
karbon-new-da1057-k8s-worker-2 789m 9% 4687Mi 63%
# Display resource (CPU/memory) usage of pods
kubectl top pods -A
NAMESPACE NAME CPU(cores) MEMORY(bytes)
kube-system calico-kube-controllers-7f66766f7f-6h29f 1m 14Mi
kube-system calico-node-4zszw 32m 51Mi
kube-system calico-node-dx4m8 30m 32Mi
kube-system calico-node-fvhkp 38m 41Mi
kube-system calico-node-h8hww 42m 45Mi
kube-system calico-typha-6bfd55df7-rhkt7 1m 22Mi
kube-system coredns-7987f4d48b-j65vk 6m 27Mi
kube-system coredns-7987f4d48b-rszx7 4m 25Mi
kube-system kube-apiserver-karbon-new2-da1057-k8s-master-0 108m 723Mi
kube-system kube-proxy-ds-45pfw 0m 23Mi
kube-system kube-proxy-ds-68hwz 0m 20Mi
kube-system kube-proxy-ds-btxsq 0m 18Mi
kube-system kube-proxy-ds-v676h 0m 19Mi
ntnx-system alertmanager-main-0 1m 17Mi
ntnx-system csi-node-ntnx-plugin-76sng 2m 45Mi
ntnx-system csi-node-ntnx-plugin-bkbnl 2m 44Mi
ntnx-system csi-node-ntnx-plugin-wnbs7 2m 49Mi
ntnx-system csi-provisioner-ntnx-plugin-0 1m 83Mi
ntnx-system elasticsearch-logging-0 497m 2084Mi
ntnx-system fluent-bit-7n84n 6m 27Mi
ntnx-system fluent-bit-l7thg 7m 31Mi
ntnx-system fluent-bit-rk462 9m 24Mi
ntnx-system fluent-bit-rzq99 5m 31Mi
ntnx-system kibana-logging-597985996-7k529 12m 226Mi
ntnx-system kube-state-metrics-68d478745c-g2vlp 1m 46Mi
ntnx-system kubernetes-events-printer-56cd8c7798-9z9ms 0m 0Mi
ntnx-system node-exporter-5nd4s 0m 21Mi
ntnx-system node-exporter-9wg88 1m 23Mi
ntnx-system node-exporter-9zk9q 0m 18Mi
ntnx-system node-exporter-fpdms 1m 23Mi
ntnx-system prometheus-k8s-0 131m 531Mi
ntnx-system prometheus-operator-57b9d47f56-phxzw 0m 25Mi
ntnx-system snapshot-controller-0 0m 10Mi
prometheus-adapter karbon-prometheus-adapter-8464456d75-6x84f 144m 179Mi
prometheus-adapter karbon-prometheus-adapter-8464456d75-zlqpk 139m 141MiAs expected, all is working perfectly!
Add an additional security layer
By default, the Prometheus Adapter helm chart configure the metrics apiservices to talk through TLS without verifying certificates (it utilizes a self-signed certificate). You can enforce security and certificate verification by providing your own certificate or by leveraging cert-manager to manage it automatically. We will explore this second option together.
The Prometheus Adapter helm chart has native cert-manager support, so integration is really easy. The only prerequisite is to have it installed in your Karbon cluster. This is done very simply by following the documentation.
Once cert-manager installed, you just need to add the following configuration at the end of your prometheus-adapter-values.yaml file.
certManager:
  enabled: true
  caCertDuration: 43800h
  certDuration: 8760h
Then you need to modify the installation of the Prometheus Adapter with the updated configuration file.
# Update your Prometheus Adapter deployment
helm upgrade -n prometheus-adapter karbon prometheus-community/prometheus-adapter -f prometheus-adapter-values.yaml
You can follow the Test the Metrics API paragraph again to verify if all is working properly.
You can also check that all the certificates configuration procedure was done correctly with the following command.
# Check certificates existence
kubectl get -n prometheus-adapter certificates

NAME                                  READY   SECRET                                AGE
karbon-prometheus-adapter-cert        True    karbon-prometheus-adapter             3m56s
karbon-prometheus-adapter-root-cert   True    karbon-prometheus-adapter-root-cert   3m57s

# Verify metrics apiservices configuration
kubectl describe apiservices.apiregistration.k8s.io v1beta1.metrics.k8s.io

Name:         v1beta1.metrics.k8s.io
Labels:       app.kubernetes.io/component=metrics
........
API Version:  apiregistration.k8s.io/v1
Kind:         APIService
........
Spec:
  Ca Bundle:               XXXXXXXXXXXXXXXXXXXXXXXXXXXXXXXXXXXXXXXXXXXXXXXXXXXXXXXX
  Group:                   metrics.k8s.io
  Group Priority Minimum:  100
  Service:
    Name:            karbon-prometheus-adapter
    Namespace:       prometheus-adapter
    Port:            443
  Version:           v1beta1
  Version Priority:  100
Status:
  Conditions:
    Last Transition Time:  2021-11-10T17:39:41Z
    Message:               all checks passed
    Reason:                Passed
    Status:                True
    Type:                  Available
Events:                    <none>
Spec CA Bundle shows you that a certificate is configured to verify the connection.
Conclusion
The Prometheus Adapter allows easy implementation of Full Metrics Pipeline in an Prometheus enabled cluster like Karbon.
In this article we are only concerned with the standard Metrics API that allows access to resource metrics (CPU and memory) for pods and nodes, but the Prometheus Adapter can also exposes other advanced metrics :
- Custom Metrics (activated by default): This API allows consumers to access arbitrary metrics which describe Kubernetes resources like pods or more generic objects.
- External Metrics: An external metric is a metric that does not have an obvious relationship to any object in Kubernetes, such as metrics describing a hosted service with no direct correlation to a Kubernetes namespace.
Metrics API exposed by the Prometheus Adapter will also allow for configuration of built-in or external autoscaling components.