

Nutanix Objects is a modern, S3-compliant object storage solution that provides a wealth of compelling features such as simple management, extensive scaling, and data security. One attribute that really sets Objects apart from other object storage solutions, however, is its strong performance that scales linearly. There is quite a lot to say when it comes to Objects performance in fact, so we thought we’d capture
the main points in this blog.
Objects Scale-Out Architecture: Designed for Performance
A sensible place to start is a brief overview of Objects architecture. Nutanix Objects consists of the following key components:
- Physical nodes –each contains a Nutanix Controller Virtual Machine (CVM), thus the underlying stratum of the Objects solution is Nutanix Hyperconverged Infrastructure (HCI).
- Worker nodes – the services that together make up Objects run inside these special VMs. In fact, Objects’ component services run on the Nutanix Microservices Platform (MSP), meaning they are
containerized and orchestrated by Kubernetes. Each worker contains an Object Controller, and each object controller contributes to the overall read/write bandwidth available in the object store.
Thus, adding workers allows I/O performance to be scaled out in a linear fashion. Metadata is also distributed across multiple workers, vastly reducing the likelihood of metadata bottlenecks. - Load Balancers – a fully integrated part of the deployment, multiple load balancers receive S3 client requests and forward them to the workers in a round robin fashion to ensure even loading.
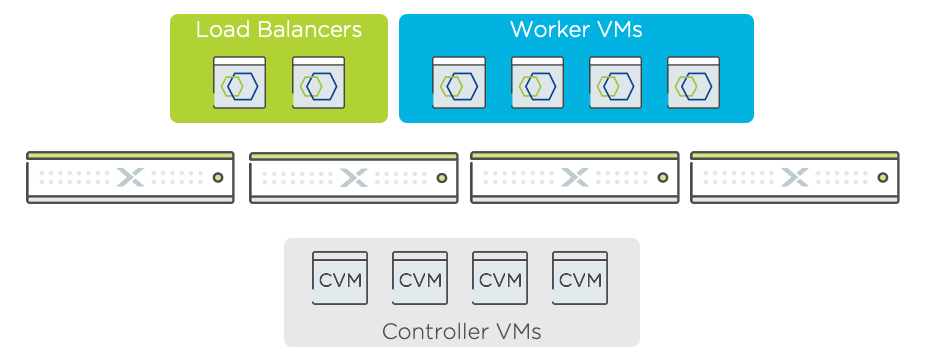
A key attribute of Objects architecture is that there are multiple instances of each of the main services per object store. This distributed approach to service deployment allows Objects to avoid performance bottlenecks and speaks to its ability to cater effectively to demanding performance requirements in a modern, scale-out fashion. As the old saying goes; many hands make light work. Further to this, there are many optimizations in relation to I/O handling and disk placement, which combine to deliver high throughput as well as low latency, which is measured in object speak as Time to First Byte (TTFB).
Performance improvements through constant innovation: TurboS3
It should be noted that in the 3.2 release of Objects the S3 frontend adaptor, which forms part of the Object Controller, was entirely rewritten resulting in significant improvements in both performance and efficiency. Prior to that we had been leveraging open-source code to provide this functionality but saw an opportunity to significantly improve performance by replacing this with a new, more optimized adaptor (now affectionately known as TurboS3). This resulted in performance and efficiency gains – in particular, small object performance received a huge boost – up to 95% performance improvement with certain workloads (small object GETS) as shown in the chart below (same hardware used with both Objects
versions).
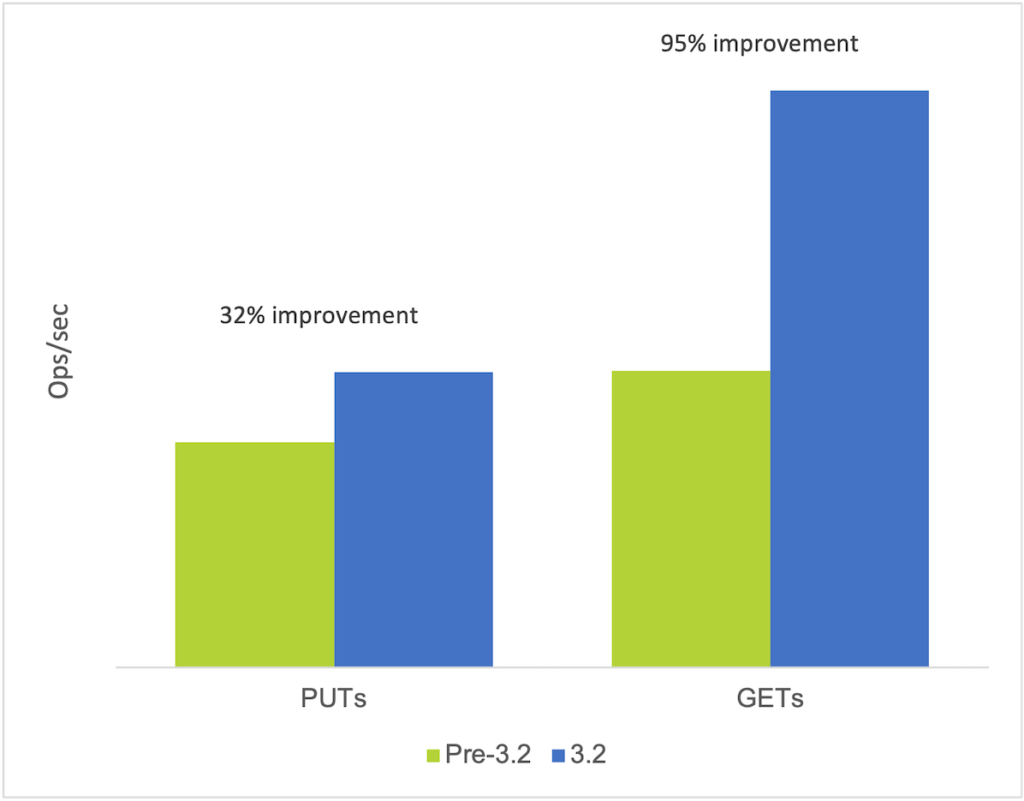
There are two points worth noting in relation to this improvement;
- It is becoming increasingly important for object storage to be able to deliver high performance with small object workloads. This is because data analytics is growing in popularity and more and more analytics applications are leveraging S3 compliant storage, like Nutanix Objects, to store and access data.
- This serves as a great example of one of the main benefits of Nutanix’s software-defined approach; constant innovations in Nutanix software engineering result in a steady stream of improvements which manifest as new functionality and/or better performance. Furthermore, because the change is 100% in software, these features and optimizations can be quickly and easily deployed to live environments allowing customers to rapidly benefit from the latest innovations.
Internal Benchmarks: All Flash and Hybrid
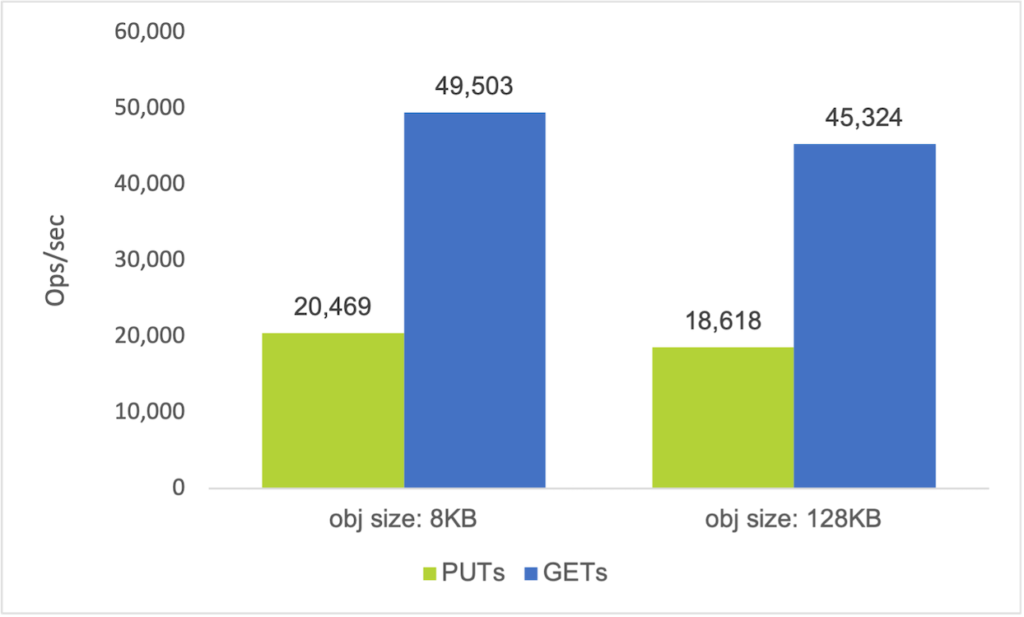
The above chart is taken from a range of tests that were carried out to characterize Nutanix Objects performance on a 4-node all flash cluster (4x NX3060-G5 nodes each equipped with 6x SSDs). To provide further insight into the level of performance achievable with Objects, a range of such tests was performed. However, a more recent run of tests was conducted on G8 nodes equipped with newer CPUs and a mix of NVMe and SSD drives; the blog draws mostly on these to demonstrate Objects’ all flash performance capabilities. Around the same time the NX3060-G5 nodes were put through their paces, tests were carried out on 4- and 8-node hybrid disk clusters so as to illustrate achievable performance with storage dense configurations – a number of these results are shown later in the blog. The hybrid clusters were deployed with Objects 3.2, while the more recent all flash cluster was deployed with Objects 3.5.1. The configurations tested were as follows;
All flash cluster (4-node)
4-node Nutanix NX8150-G8 cluster:
- All-flash storage (4 × 3.84 TB NVMe, 14 × 3.84 TB SSD)
- Dual Intel Xeon 8358 CPU (2.6 GHz, 32 cores)
- Quad 100 GbE NIC
Hybrid disk cluster (4-node)
4-node Nutanix NX-8155-G6 cluster:
- Hybrid storage (2× 3.84 TB SSD, 10× 8 TB HDD)
- Dual Intel Xeon Gold 6148 CPU (2.4 GHz, 20 cores)
- Dual 25 GbE NIC
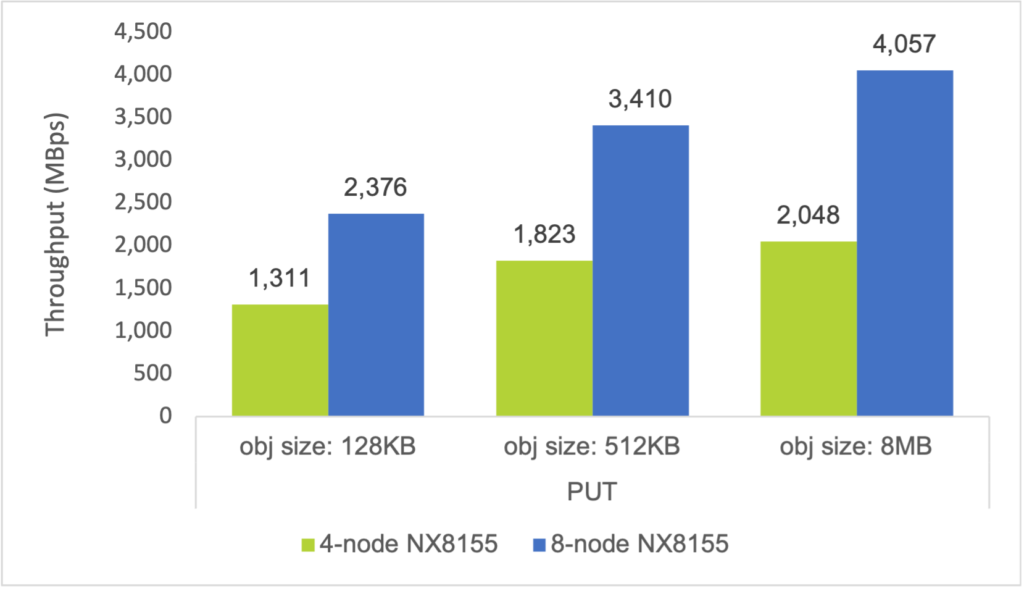
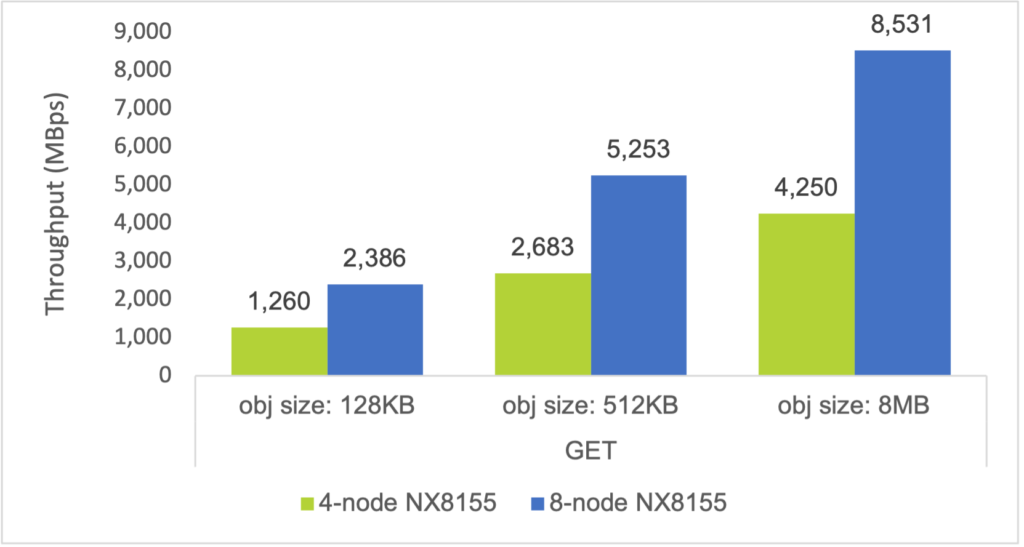
Hybrid disk cluster (8-node)
8-node Nutanix NX-8155-G6 cluster:
- Hybrid storage (2× 3.84 TB SSD, 10× 8 TB HDD)
- Dual Intel Xeon Gold 6148 CPU (2.4 GHz, 20 cores)
- Dual 25 GbE NIC
In all cases there was an Objects worker VM on every physical node in the cluster. We ran PUT and GET commands on four separate buckets, using a 600 GB working set for reads for the 4-node hybrid configuration, an 800GB working set for the all flash configuration and a 1200 GB working set for the 8-node hybrid configuration. For the hybrid configurations, we ensured that the HDD tier served all read I/O. To balance network traffic, we implemented a balance-slb network bonding policy on the hybrid hosts while on the all flash hosts a balance-tcp policy was used. We also enabled multiqueue on all data path vNICs. For the all-flash setup a number of additional software tunings were applied to achieve the maximum performance possible.
The first chart below shows the ops/sec performance the 4 node all flash Objects cluster was able to achieve with small object sizes, an I/O profile that must be accommodated in many analytics environments. Also relevant to this type of workload profile are latency figures (expressed in the form of Time to First Byte) – these are shown in a later section, following the hybrid disk node results. Note that in all of the charts shown below the PUT figures were derived from 3-minute runs, and so do not represent sustained activity.
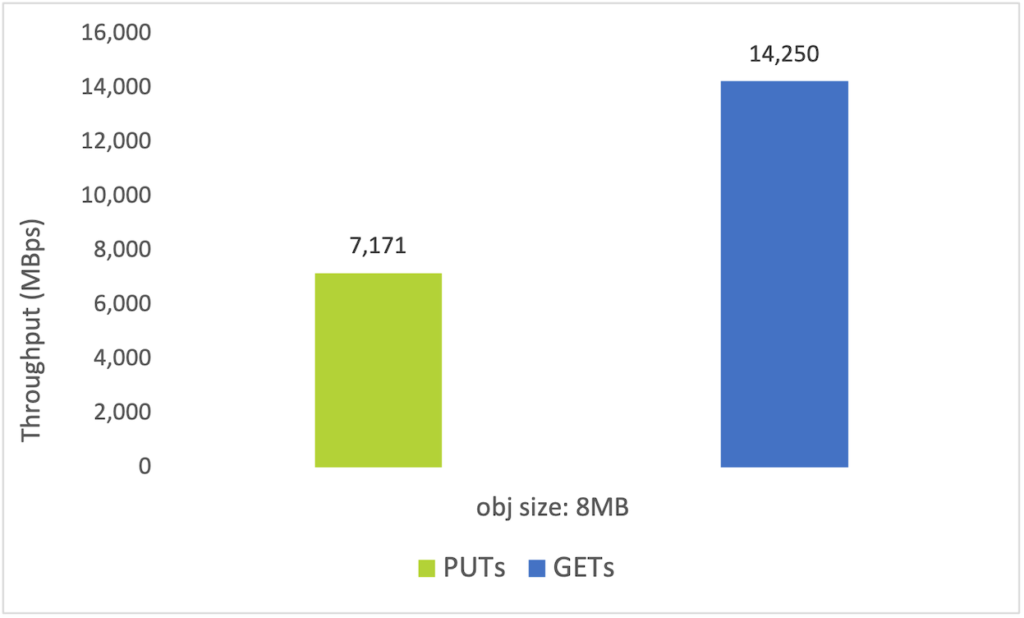
The next chart shows throughput achieved with large objects on the 4 node all flash cluster. The results here are also impressive, illustrating the versatility of the all flash Objects solution in terms of delivering blistering performance for any kind of workload.
The below charts, which compare the maximum aggregate throughputs achieved by the 4-node hybrid cluster and 8-node hybrid cluster, illustrate the linear performance scaling that Objects delivers.
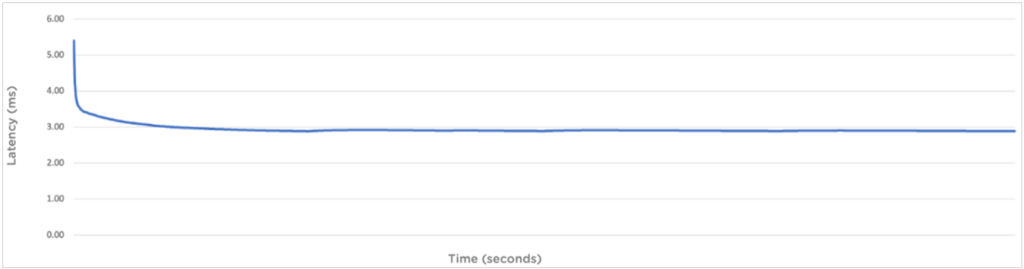
Time to First Byte (TTFB)
While latency has historically not been a strength (nor a concern) of object storage, these days with analytics workloads it is becoming increasingly important. Time to First Byte (TTFB) is a measure of object storage latency, specifically the time taken to retrieve the first byte of data from an object. It’s measured at the S3 client as the elapsed time between submission of a GET request and receipt of the first byte of data. TTFB represents uncached metadata read latency, uncached data read latencies and network latencies and it showcases the overall latency a client is likely to experience before it starts receiving the first byte of data. Sub-10ms TTFB is ideal for latency sensitive applications. From the below chart you can see that Objects achieved a GET latency of around 2.89ms.
Metadata TTFB is lower still, as the below graph shows. The metadata TTFB is the time taken to retrieve a HEAD response for an object. This measure showcases the overall latency the client is likely to experience when fetching metadata for an object; around 1.14ms as the chart shows.
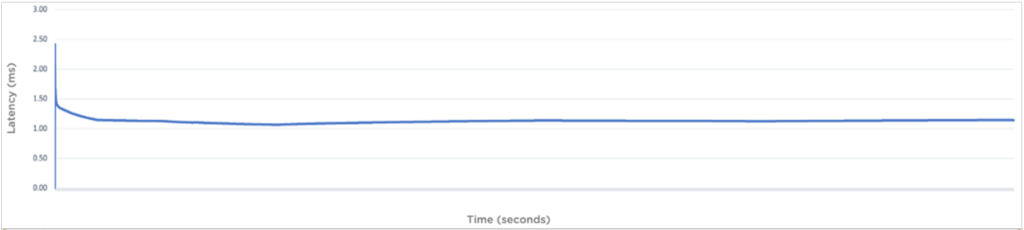
The above graphs show that the latency associated with ongoing lookup and read operations in Nutanix Objects remains low and consistent. The length of the tests (multi-hour) illustrates how Objects delivers high performance with unwavering consistency even when the client activity is sustained for an extended period.
To maintain applicability to a variety of real-world scenarios, we designed the tests to avoid reliance on caching, which we achieved by clearing all caches at the start of the test and by reading unique objects from a very large working set. Thus, each new object read triggered a disk lookup.
Optimizations for List Performance
In Objects 3.5.1 a further optimization was introduced; the metadata block cache was substantially increased in size. Importantly, this increase does not require additional memory to be provisioned by the underlying hypervisor. Rather, the extra memory has been freed up through optimizations applied in other areas of the Objects architecture.
The increased metadata cache provides latency reduction benefits in specific scenarios. For example, when list operations are performed repeatedly these are now more likely to be served from cache, avoiding the need to go to disk. An example of where list operations tend to be performed frequently is applications that were originally developed to work with a filesystem but have since been adapted to use the s3 API. Under the covers these apps still work in terms of directory structures, which can be mimicked by object stores through the use of delimiters (such as a slash ‘/’) and prefixes, representing layered directories and file paths. However, before any operation can be performed against a file (read:object) the system must check for the existence of that object, and this is achieved by running a list request. In general, analytics apps must perform lists in order to identify objects of interest before the actual data operation can be executed. Minimizing the latency of the list phase speeds up the end-to-end operation.
The below chart shows the % improvement in list entries when the requested data is cached versus uncached. Before you inspect the chart, here is a brief description of the test dataset.
- Two level directory hierarchy of the structure; bucket/level0_dir/level1_dir/level2_object.
- 10 directories at level 0, 500 level 1 subdirectories under each level 0 directory, and 1,024 level 2 objects under each level 1 directory.
- Total 5 million objects at level 2.
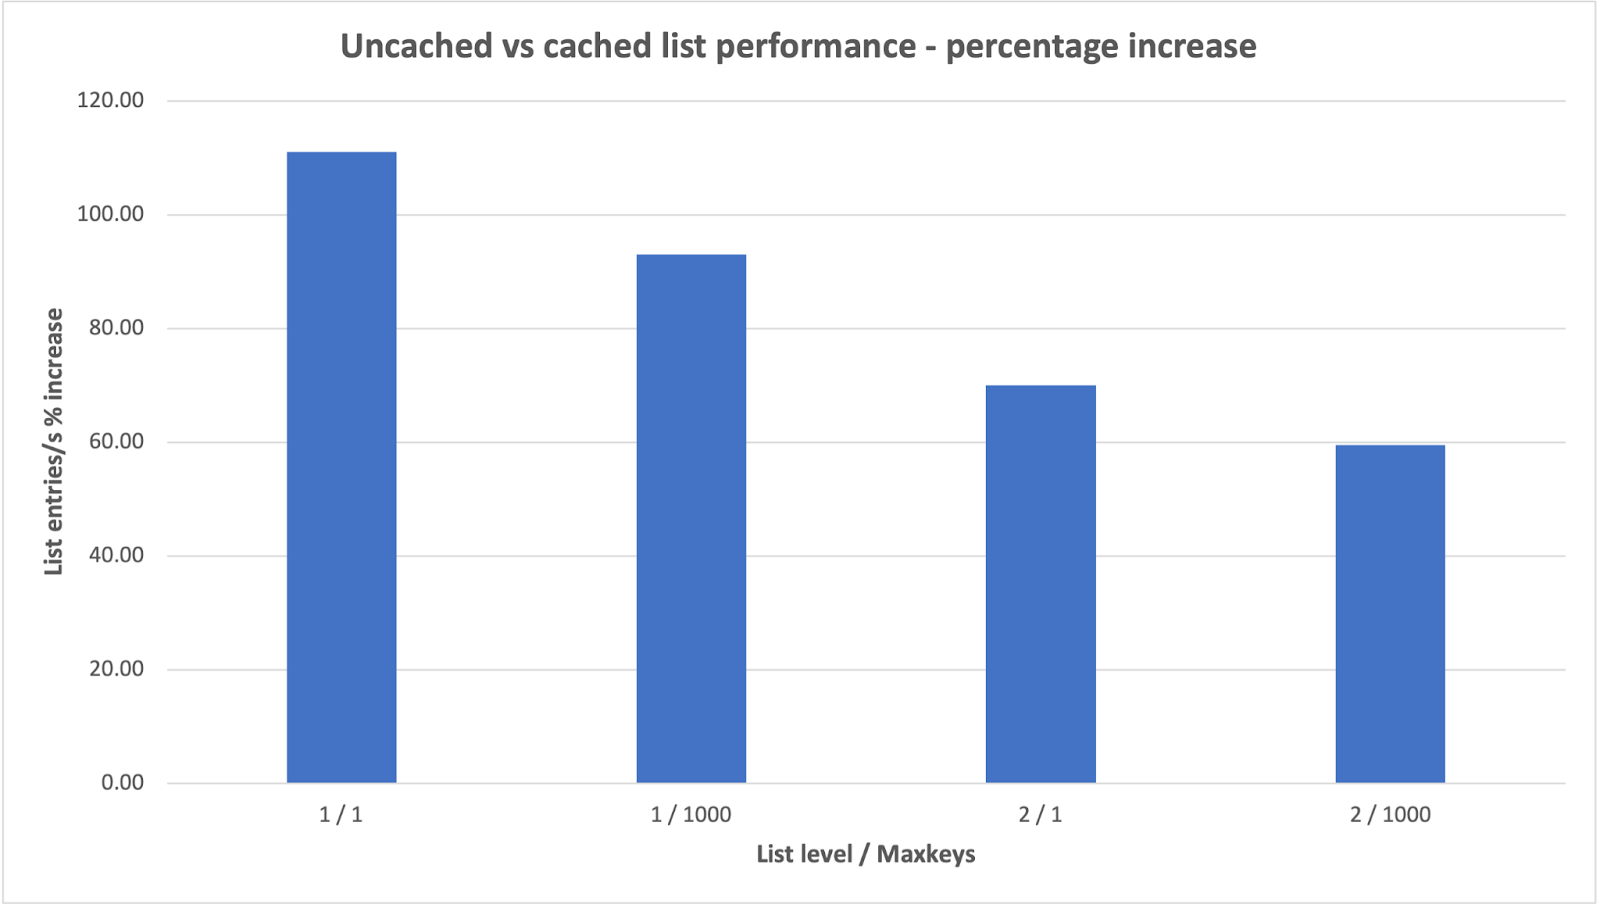
Note: These list performance tests were conducted on earlier generation G5 all flash nodes equipped with 6x SSDs.
We’ve discussed how list operations are used extensively in data analytics environments. Objects indeed has other features that are designed specifically to improve both performance and efficiency in these types of environments. Let’s look at those now, starting with Hadoop/Spark workloads.
Hadoop/Spark with Objects (TeraGen benchmark)
The first thing I’d like to make clear is that Hadoop includes the S3A adaptor which efficiently translates HDFS filesystem calls to S3 API calls, thus allowing an external S3 object store to be used instead of HDFS, which is local to the Hadoop workers. This disaggregation of compute and storage allows these respective layers to scale at different rates as well as providing a number of other benefits.
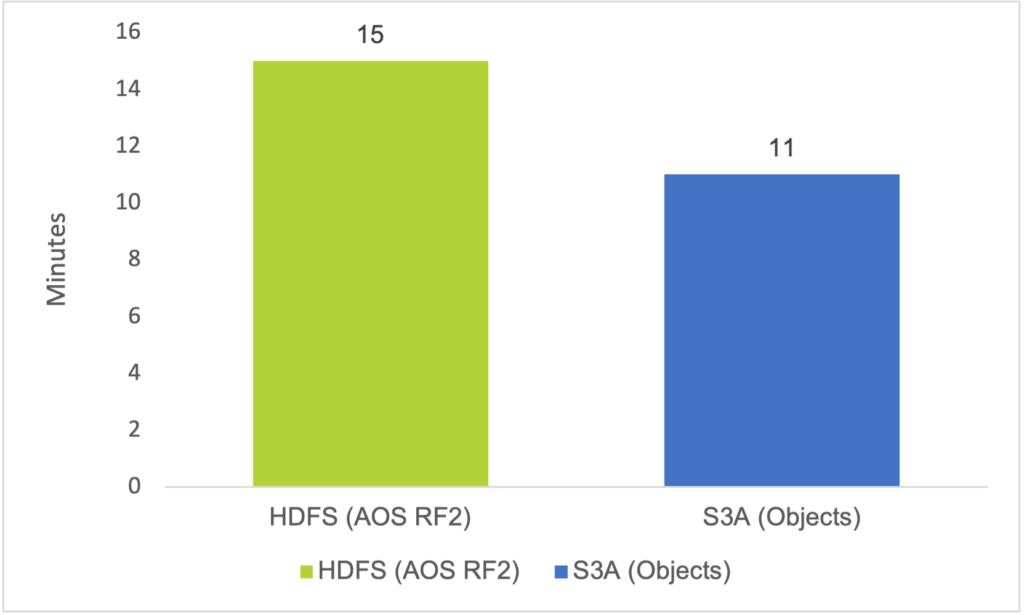
With that in mind now let’s talk about MapReduce (MR). MR, a core component of the original Hadoop framework, is a distributed computing paradigm where problems are broken up into chunks and individual compute nodes each tackle a specific part of the problem. Consequently, huge volumes of data can be crunched through much more quickly than would otherwise be possible. However, this process was originally designed to work with the Hadoop file system (HDFS) and it typically involves a huge amount of directory renames; when a reduce task completes, the reduce worker renames its temporary output file to the final output file. Renames are cheap, atomic operations in a POSIX filesystem, but this is not the case with object storage. Object data is inherently immutable and thus overwrites, which includes renames, are not possible. Instead, a copy operation must be performed (the copy is given the new name) followed by deletion of the original object. However, whereas renames in a filesystem are fast and inexpensive, copy operations are slow and more taxing on system resources because they involve writing out lots of new data. This is where Nutanix Objects’ fast copy helps; it replaces the need to make a full copy with the ability to copy only the object’s metadata, which results in a new logical copy as far as the application is concerned but in a fraction of the time and at much lower cost to system resources.
To quantify the improvement made by the fast copy feature we did some internal benchmarking comparisons using TeraGen. TeraGen is a widely used MapReduce tool used to generate data for testing purposes. Our testing, which was based on a 1TiB dataset, found that fast copy accelerated completion times by a factor of almost 6x – another great example of how changes made purely in software can result in big operational gains. Moreover, this innovation resulted in job completion on Nutanix Objects being 26% faster than when the same job was run on the Hadoop filesystem (HDFS) on a Nutanix AOS cluster using RF2. Completion times were 15 minutes with HDFS and 11 minutes with Nutanix Objects with fast copy.
S3 Select: SQL Query Offload
Objects also supports S3 Select, a feature designed to improve the handling of queries generated by interactive SQL query-based apps (such as Presto and Spark) against data files stored in Nutanix Objects. By data files, I mean CSV files containing rows of record-type information. There might be a sizable collection of these files comprising the target dataset and each file might contain thousands upon thousands of rows. Without S3 Select the querying application must read each of these files and sift through them in turn to find the rows of data it is interested in – this can be a lot of work. S3 Select removes this burden from the application by offloading this responsibility to Nutanix Objects. The job is ‘pushed down’ to the Objects workers, which search through the files on behalf of the app and return to it only the filtered results, just the data of interest. In doing so, Objects frees up application resources and network bandwidth resulting in faster, more efficient query handling. Essentially the compute is being brought to the data, rather than the other way round.
Some benchmarking was done to quantify improvements resulting from use of S3 Select. The same select query was issued against a 2.73GB dataset by Presto twice, once with S3 Select leveraged and once without. Rather than yielding a directly performance-related gain, the improvement was more in terms of reduced consumption of network bandwidth and application CPU time. However, freeing up application resources in such a way can help application performance indirectly. The below table shows the degree to which network and CPU utilization were reduced.
| App CPU time (secs) | Total rows copied | Total data copied (KiB) | |
|---|---|---|---|
| Without S3 Select | 34.99 | 60,000,000 | 2,862,612 |
| With S3 Select | 0.104 | 2,760 | 75.5 |
| Improvement | 336x lower | 21,739x fewer | 37,915x less |
Testing Vertica with Objects (TPC-DS benchmarks)
There are some distributed SQL query-based apps that do not leverage S3 Select because they have their own offload capabilities. Two such apps are Vertica and Dremio. Vertica has validated Nutanix Objects for use with its analytics platform, while Dremio is currently going through this process. The performance benchmarks we completed with Vertica illustrate the kind of performance levels that can be achieved with a Vertica + Nutanix Objects combination. The benchmark tests were run on the following setup;
Configuration: Vertica Application (dedicated)
3-node Nutanix NX-8170-G8 cluster (running 6 Vertica nodes):
- All-flash storage (at least 2× 0.75 TB NVMe with Intel Optane and 8× 1.92 TB NVMe)
- Dual Intel Xeon Gold or Platinum at least 2.80 GHz, at least 24 cores per socket
- 768GB memory
- Dual 100 GbE NIC
Configuration: Nutanix Objects (dedicated)
8-node Nutanix NX-8170-G8 cluster:
- All-flash storage (at least 8× 7.68 TB NVMe)
- Dual Intel Xeon Gold or Platinum at least 2.80 GHz, at least 16 cores per socket
- At least 128GB memory
- Dual 100 GbE NIC
Vertica’s Eon Mode was used – this separates compute from storage, using S3 object storage (Nutanix Objects in this case) and dynamic allocation of compute nodes. TPC-DS was used to generate queries against the lab setup. TPC-DS is an industry standard decision support benchmark that measures aspects such as query response time in single user mode and query throughput in multi user mode. The purpose of TPC benchmarks is to provide relevant, objective performance data to industry users.
Tests were run against a 10TB dataset with a comparative baseline in each case provided by Vertica. The baseline was derived using AWS r4.8xlarge EC2 instances (32 CPU, 256 GB of memory, EBS-only storage, 10 Gbps network) and AWS S3 as the object storage platform hosting the Vertica Eon Mode database. Nutanix was not involved in these baseline tests. Vertica provides a caching capability known as ‘Depot’ that can improve performance, tests were performed with Depot both on and off.
The following table indicates how Nutanix is significantly faster than AWS in the TPC-DS benchmarking tests for the 10 TB dataset with Depot on and off. Note that only the query workloads were generated by TPC-DS, Load and External table are Vertica metrics.
| Tests | Nutanix 10TB, Depot On | Nutanix 10TB, Depot Off |
|---|---|---|
| Load | 100% faster | N/A |
| External table | 36% faster | 38% faster |
| One user | 23% faster | 22% faster |
| Four users | 38% faster | Approximately the same |
Indirectly Improving Application Performance
With distributed applications like these there is considerable value in also running the application itself on Nutanix Hyperconverged Infrastructure (HCI) all flash nodes, virtualized on the embedded AHV hypervisor. Nutanix HCI delivers linear performance scaling for the application and with Objects providing a fast, scalable storage tier, this makes for an excellent end-to-end solution.
Other big data applications for which Nutanix Objects is a validated storage solution, and where the application layer itself can run on Nutanix AHV, include Splunk and Confluent Kafka. Objects is a validated SmartStore solution for Splunk and a validated Storage Tier for Confluent. The result in each case is a high performance end-to-end infrastructure solution for the application, where data is optimally placed for cost and performance and the whole end-to-end setup is managed and supported in a consistent manner. In both cases, Objects serves as an ‘offload tier’ for older data and in the case of Confluent Kafka in particular, this additionally helps preserve application performance by allowing data to be retained for longer periods without bloating the application’s primary storage tier. Such bloating would not only increase storage and compute costs, it introduces bottlenecks and additional system overhead that can significantly degrade the performance of the Kafka brokers. Tiering older message data to Objects mitigates this problem in the following ways; (i) brokers can allocate more resources to producer and consumer requests rather than background replication tasks, (ii) when a broker fails data re-protection completes in minutes rather than hours and (iii) consumer requests for real time data are isolated from consumer requests for older data, thus eliminating blockages that otherwise occur on the I/O path. In this sense Objects indirectly helps to maintain Kafka’s performance as data retention grows. Furthermore, if tiered Kafka (or Splunk) data needs to be accessed Objects facilitates its rapid retrieval. In internal testing of Objects with Confluent Kafka, tiering throughput reached ~1GBps while fetcher throughput (i.e. retrieval of tiered data) reached ~1.8GBps. In both cases a very modest setup was used; 12 Kafka brokers while the Nutanix object store contained 4 worker nodes and 3 load balancers. The Nutanix solutions for Splunk and Kafka, including the role played by Objects in each case, are described in the Splunk on Nutanix Reference Architecture and Kafka on Nutanix Tech Note respectively.
With its excellent performance and capacity scaling properties, and support for features like fast copy and S3 Select, Objects is a superb choice for anyone wishing to build a data lake or run data intensive analytics workloads such as logging, SIEM, AI/ML and data pipelines. Indeed, anyone who has a high-performance object storage requirement of almost any kind – and who wishes to avoid complex infrastructure management – need look no further than Nutanix Objects.