
")
By Harshit Agarwal and Samuel Gaver
Introduction
Nutanix is a hyperconverged platform, and all its services (including storage services) run on a special virtual machine (VM) called the controller VM (CVM). This CVM currently runs the CentOS Linux distribution with kernel version 3.10. Unfortunately, this kernel version is quite old and poses a few challenges, which motivated Nutanix to upgrade to a newer version.
Why upgrade?
- Eliminate painful backports: When we encountered a bug or a security issue, we would occasionally have to backport a change from a newer version of the kernel to 3.10.x. These backports are incredibly time consuming and require a lot of developer effort to ensure that the changes are still applicable and ported correctly. Additionally, manual backports burden QA teams, as they have to test and validate each change.
- Take advantage of new features: More recent kernels provide new features like io_uring and BBR, improving CPU efficiency and performance in our I/O stack and allowing us to handle more demanding workloads.
- Align with LTS support: 3.10 support ended in 2017. Using a recent LTS kernel helps us get support from the Linux community, which backports all the necessary bug fixes. Coordinating with the LTS train is significantly better than manually monitoring fixes and then backporting them.
- Improve performance: Better compute performance on AMD Zen and fast commits in ext4 are two of the new kernel’s improvements that can help us achieve better performance with the same hardware.
What’s the problem?
We chose 5.10 because it was the latest kernel LTS version when we started this work. The transition from the old 3.10 kernel to the new 5.10 kernel was a giant version leap that affected many services in the CVM, especially performance-sensitive services. Most of the problems that weren’t related to performance resulted from kernel behavior changes between the two versions. One such change was the way they differed in cgroup memory accounting. This accounting change caused several services to encounter out-of-memory errors, which forced us to revisit each service limit.
In the following sections, we go over the performance-related problems in more detail. We describe each problem we faced, then follow up with how we tried to address it—including what worked and what didn’t.
Note that we obtained the performance numbers we refer to in this post in a test environment. We provide these numbers to show relative differences in performance between test runs, not to represent the real-world performance of Nutanix clusters in production.
Problem 1: Overall slow random I/O performance
When we started with the 5.10 kernel, we saw an overall 10 percent degradation in random I/O performance. The next table presents the external benchmark result.
| Test | Kernel Version 3.10 | Kernel Version 5.10 |
|---|---|---|
| rand_write (IOPS) | 38,196 | 35,106 |
| rand_read (IOPS) | 44,876 | 48,621 |
Test Notes:
- Test tool: VDBench
- 8 KB block size
- 1 outstanding I/O per user VM (UVM) disk
- 8 disks per UVM with 8 UVMs = 64 UVM disks total
Testbed
To understand the problem, we eliminated as many variables as possible to reproduce the slowdown. First, we ran our test locally on the CVM, removing any additional complexity involved in the I/O path in the hypervisor. Next, we used the built-in performance testing tools embedded in our I/O controller, which reduced our exposure to the interprocess communication (IPC) traffic encountered with tools like fio. Finally, to eliminate any network-related issues, we conducted these experiments with a replication factor of 1 and created clusters with only one node.
Nutanix distributed storage manages all I/O with a process called Stargate. Stargate has a built-in utility called perf_test that can drive I/O with different storage access patterns and block sizes. With the perf_test utility, we ran both random and sequential workloads and reliably reproduced the performance issue across multiple runs. Random workloads consistently showed performance degradation, while sequential workloads saw a slight improvement.
The hardware setup used for this test was a basic all-flash node, the most popular deployment among our customers. We also set up an equivalent cluster with the same hardware specification to run the older 3.10 kernel. By eliminating so many potential factors, we could confirm that the problem was somewhere in the kernel, as the difference in performance between the 3.10 and 5.10 kernel versions was clear.
When debugging performance issues, it’s critical to have a short test like this one that can reproduce the issue. This reproducible and straightforward setup helped us iterate quickly to understand the problem and confidently validate the solution.
Debugging
Once we had traced the problem to Stargate, we started looking at it from two angles: either the disk I/O was slow, or Stargate was not getting enough CPU cycles. To give some context, Stargate is very compute-heavy and consumes most of the resources on the CVM. Therefore, even a tiny variance in CPU availability for Stargate causes large fluctuations in I/O performance. To minimize I/O latency, Nutanix uses real-time (RT) scheduling for data services, including Stargate, to overcome any unexpected delays caused by the default Completely Fair Scheduler (CFS). RT scheduling also gives the higher priority data services precedence over noncritical background and maintenance services.
We ran a few benchmarks for disk I/O, and they all looked similar across both kernels. Nothing stood out in the disk stats, either. However, we saw that Stargate consumed significantly less CPU in the 5.10 kernel than it did in 3.10. Using our internal stats in Stargate to dive deeper for threads driving I/O, we could see that the dip in CPU consumption correlated with the gap in performance across the two kernels. This find shifted our focus to CPU and specifically to RT scheduling, which Stargate relies on heavily. High-performance data services use RT scheduling and have affinity established with a set of CPU cores, allowing them to use the bound cores extensively without starving out background services that can run on the remaining cores.
There have been many changes between these two kernel versions in the scheduler, especially the RT element. Because we wanted to bring the 5.10 performance up to the 3.10 level, we started looking at the relevant scheduler code changes and the corresponding scheduling feature flags. To begin with, we found the following differences and similarities between the two kernels.

Differences
Utilization estimation
UTIL_EST and UTIL_EST_FASTUP are two options that are not present in the 3.10 kernel. The scheduler’s per-entity load tracking (PELT) module tracks various metrics for the scheduling entities and computes a task’s average utilization. The load contribution of the task decays over time such that the most recent utilization contributes the most load. Because the averages for periodic tasks decay while the tasks sleep, even though their expected utilization remains the same when running, they have to ramp up again when they resume. This task ramp-up is an issue for Dynamic Voltage and Frequency Scaling (DVFS) architectures, as they can enter a low-power state where required CPU may not be available. Two options can help alleviate this ramp-up penalty: updating the utilization estimate to use the Exponentially Weighted Moving Average (EWMA) and changing the time an entity spends running on the CPU on dequeue.
Because we aren’t relying on DVFS, we turned off these flags altogether to avoid any overhead or unexpected scheduler behavior changes.
Wake affinity methods
Wake affinity methods in the scheduler (wake_affine_idle and wake_affine_weight) determine the first CPU that can be available to run a task. These methods tend to put a wakee task close to the waker task, intending for the tasks to share caches on the same CPU. The wa_idle option specifies that if the previous CPU is idle and has cache affinity, then the task migrates to the previous CPU from the CPU that woke up the task. This approach prefers idle CPU over cache affinity. Along similar lines, the wa_weight option considers the average scheduling latency of the CPUs and targets workloads that leave no idle CPU where wa_idle regresses. However, because various performance-critical processes have CPU affinity, including the interrupt request (IRQ) handler on the CVM, disabling these flags prevents unnecessary migrations and results in better overall throughput.
Using interrupt to trigger RT task push migration
When RT_PUSH_IPI is enabled, the interprocessor interrupt (IPI) goes to the overloaded CPU to initiate a push operation. If many RT tasks are waiting to run on a single CPU and that CPU schedules another RT task of lower priority, the system initiates pull logic in case there’s a higher priority RT task on another CPU waiting to run. However, when one of the CPUs is overloaded with RT tasks and multiple CPUs are idle, the idle CPUs initiate the pull simultaneously. As part of the pull operation, they all contend for the run queue lock. However, because only one CPU can get the lock at a time, the others end up waiting.
Push logic is designed to reduce this contention. It sends one IPI to the first overloaded CPU and pushes any tasks that it can. Then it looks for the next overloaded CPU that can push to the source CPU. The IPIs stop when all overloaded CPUs with pushable tasks that have priorities greater than those on the source CPU are covered.
The push mechanism uses IPI, and the IPI latencies added more overhead to our system than benefits. The advantages of this mechanism may be more apparent on systems with high core counts and when RT processes don’t have affinity with a limited subset of those cores.
Fixes and Results
After determining the five scheduler feature flags that could impact our system’s performance (NO_RT_PUSH_IPI, NO_WA_IDLE, NO_WA_WEIGHT, NO_UTIL_EST, and NO_UTIL_EST_FASTUP), we disabled them. After turning off these flags, the 5.10 performance was on par with 3.10 performance. Here is a summary of the numbers:
With these scheduler changes, we got over the first hurdle in fixing our performance regression. But this was just the first hurdle, not the only one.
Problem 2: Mysterious latency spikes
One of the advantages of having a human do performance testing is that they can spot oddities that may not show up in automated testing. During hands-on performance testing, we noticed a periodic latency spike when doing low outstanding random reads. Continuing on the same testbed we used for the previous experiment, we drove I/O from a user VM instead of pushing it directly from Stargate. We emulated a real-world workload using an I/O generator and the performance measurement tool VDBench. Every 10 seconds, we saw a 100+ ms spike in the user VM (UVM) VDBench output.
The chart below shows the periodic latency spikes with 5.10 (bottom) compared to the smoother latency chart for 3.10 (top).

The overall rand_read latency with version 5.10 was lower, but the average max latency was much higher. This anomaly intrigued us, and we needed to figure out why it was happening.
It’s also worth noting that these latency spikes showed up only in the I/O test that had a queue depth of one. With higher queue depth runs, the system was busier, and the average latency was much higher. Hence, the latency spikes were lost in the noise.
Background
As some context for the next section, you may want to review the layout of our CVM. For this discussion, we’re particularly interested in the path from the hypervisor network stack to the Stargate process on the CVM.

Experiments
With this background in mind, let’s go through the various things we tried to analyze the root cause of the issue:
- Our first assumption was that some process or job was running periodically, consuming CPU or disk bandwidth, so we stopped all nonessential services in the CVM. However, the spikes persisted.
- We performed the same test on ESXi, and the spikes persisted. The reproduction on ESX indicated that the latency spikes didn’t have anything to do with the CVM network drivers, as AHV and ESXi use different in-guest network drivers.
- We then used the perf_test utility, which generates I/O within the Stargate process (similar to our setup in the first problem), in order to eliminate the path complexity between a UVM and the CVM. We also used replication factor 1 containers to avoid any replication writes to other CVMs and the network latency associated with those writes. With this test, we could NOT reproduce the latency spikes, which clearly indicated that the spikes are triggered somewhere outside of Stargate, not by a Stargate background task. Nor was it an issue with Stargate not getting scheduled, as we saw in the Problem 1 section.
- Then we short-circuited Stargate at the I/O ingress layer. By short-circuiting the ingress (admission controller) layer, we remove all Stargate code in the data path and only exercise the network layer. In this configuration, Stargate simply acknowledges the write and returns zeros for reads. Running VDBench from the UVMs still reproduced the latency spikes, further confirming our theory that something outside Stargate and probably in the kernel was the root cause.
- Finally, we used tcpdump and Wireshark filtering on the highest response time to show that the packet with high latency left the hypervisor NIC at T0 and arrived in the CVM NIC at T0 + 90 ms. Thus, we could see that the latency was coming somewhere between the hypervisor NIC’s egress and the CVM NIC’s ingress. This considerable time lapse was very interesting; the CVM is on the same host as the UVM, so the path from the hypervisor NIC to CVM NIC should be very fast, as it’s effectively just memory copies. Moreover, as tcpdump operates at a very low level, the spikes had to be caused by something below where tcpdump traces.
At this point, we had a clear view of where the issue resided. As nothing in the hypervisor changed, we could rule out anything there, so it had to be something unique to the new CVM kernel—but what?
The SystemTap diversion
The next path we took turned out to be a diversion; while interesting and possibly useful in the future for other bugs, it wasn’t helpful for the latency spikes. We generated some FlameGraphs during the slow performance, then used some excellent SystemTap scripts from the folks at CloudFlare to profile specific TCP kernel calls to see their latency, as we were focusing on the network layer.
This effort, unfortunately, was not beneficial in the end. The histogram results were all over the place, and the latency spikes we saw didn’t always have corresponding spikes in histograms. As a result, we abandoned this line of debugging.
A breakthrough
Similar to how performance-critical data services have affinity with specific cores in the CVM, IRQ handling also has affinity with a few cores. Keeping the cores mutually exclusive prevents any unnecessary contention in the CPU between Stargate and network interrupt handling. When we limit IRQs to a certain set of CPUs, we need to disable the irqbalance service, which distributes these interrupts across all the cores. Interestingly, when we balanced our IRQs as an experiment, the periodic latency spikes almost went away. This outcome nudged us to investigate the tasks on the cores that were handling these network IRQs.
Because we’d previously stopped everything on the CVM, the top -H output was pretty empty—there were only some disk threads when running random read workloads. While running some tests, we noticed that a thread named vip_util popped up in the top output. This thread wasn’t really high up in the output, but we were completely out of ideas at this point. As a test, we stopped vip_monitor, which spawns vip_util, and voilà—the latency spikes went away!
Root cause
As mentioned earlier, we run various crucial services on the CVM with RT priority so they’re scheduled as quickly as possible and so they don’t starve in case of CPU contention.
So what is vip_monitor? It’s a service that periodically checks the CVM to see if it can host the floating virtual IP (VIP) associated with iSCSI and user control path operations. The part of vip_monitor relevant here is the local network check that an external program named vip_util (the same program spotted in our top output) performs. The vip_util process brings up a service infrastructure, then issues an ioctl system call to get the status of the network link. Although the vip_util process is relatively lightweight, it runs with RT priority, as it inherits the priority and scheduler setting of the parent.
To proceed, let’s see how we use our CVM’s various cores. The CVM we used for testing had 8 vCPUs, as depicted in the following table. We’ve assigned a color to each process, indicated their priority through row precedence, and noted where each of them has affinity. As per the diagram, Stargate runs with higher RT priority than vip_monitor on CPU2–CPU7.
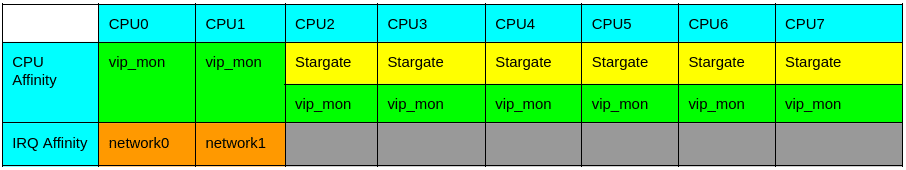
We establish affinity between Stargate and CPU2–CPU7 in an 8 vCPU configuration to ensure that we have two cores for other services and that we don’t block SSH access during heavy I/O. To accomplish the latter, we establish affinity between the network interrupts and CPU0 and CPU1.
Now we need to have a quick discussion of network interrupts. When a NIC receives an I/O operation, it generates an HW interrupt (commonly referred to as the top half). As HW interrupts mask other interrupts, we need to service them quickly. As a result, the top half doesn’t do much more than queue some work (for the bottom half) on a softirq queue and return. Kernel threads named ksoftirqd/<cpunum> pick up events from the softirq queue and do the rest of the work for the packet. Each CPU has a separate queue, and the softirq queue in which the bottom half is queued is on the same CPU that handles the HW interrupt’s top half. For example, if the HW IRQ was on CPU0, the softirq queue used for the bottom half would also be CPU0, and the ksoftirqd/0 thread would service that packet. (Note that all of this work happens below where tcpdump traces.)
You can see this division of interrupt handling in the following mpstat output. All the network traffic happens on CPU0 and CPU1, while all the block I/O is on the Stargate CPUs.
sudo mpstat -I SCPU

08:40:00 PM  CPU       HI/s    TIMER/s   NET_TX/s   NET_RX/s    BLOCK/s IRQ_POLL/s  TASKLET/s    SCHED/s  HRTIMER/s      RCU/s
08:40:00 PM    0       0.00     104.31       0.01   43924.35      41.42       0.00       3.15      67.03       0.00     761.08
08:40:00 PM    1       0.00      92.00       0.01   32644.21      73.73       0.00       3.67      72.12       0.00     731.32
08:40:00 PM    2       0.00     218.20       0.96      75.17    2699.12       0.00       0.08     232.29       0.01     480.61
08:40:00 PM    3       0.00     214.70       0.94      64.89    2694.66       0.00       0.08     226.59       0.01     477.86
08:40:00 PM    4       0.00     213.53       0.98      59.24    2713.62       0.00       0.08     219.56       0.01     479.78
08:40:00 PM    5       0.00     213.74       0.98      60.40    2780.72       0.00       0.08     206.89       0.01     487.93
08:40:00 PM    6       0.00     216.50       0.99      56.12    2810.43       0.00       0.08     200.55       0.01     482.76
08:40:00 PM    7       0.00     211.03       0.99      56.98    2894.45       0.00       0.08     192.21       0.01     483.27
Unlike Stargate, the vip_monitor service doesn’t have affinity with any CPU. Instead, the kernel scheduler decides where to run it based on how busy the other CPUs are. Because Stargate is CPU hungry, it typically fully utilizes CPU2–CPU7. As a result, vip_monitor is usually scheduled on CPU0–CPU1, overlapping with the cores that service network interrupts.
Now to the root cause hypothesis. When vip_monitor called vip_util and vip_util happened to run on CPU0–CPU1 as RT, it was scheduled ahead of any ksoftirqd threads servicing network I/O running on that same CPU, causing latency spikes. The length of time that vip_util took to run directly affected the duration of the latency spike.
This hypothesis was easy to prove. We put all the network IRQs on CPU0, started a ping flood to the CVM, then manually called vip_util running as RT with a taskset of CPU0. The result was an on-demand latency spike every time the vip_util command was called. Then, to prove that vip_util wasn’t misbehaving, we created a program to just burn CPU (generate random numbers) for a short time. Predictably, running this program instead of vip_util also triggered a latency spike. Thus we learned that it doesn’t matter what work the process is doing; as long as it is RT and running on CPU0–CPU1, a process can block the servicing of lower-half network IRQ handling and cause egregious latency.
The Fix
After finding the root cause, the fix was relatively trivial. We changed the scheduling policy of the ksoftirqd threads to RT and made their priority higher than vip_monitor’s priority. With this simple one-line change, all the latency spikes went away!
The charts below show performance for version 3.10 (top), baseline 5.10 (middle), and 5.10 with ksoftirqd scheduler changes (bottom). The max latency is very stable after the ksoftirqd changes—in fact, it’s even more stable than on version 3.10.

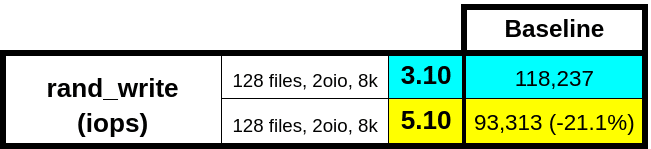
Problem 3: Low random write throughput
With our periodic latency spike behind us, you might think we were free and clear, right? Wrong! Our random write throughput still regressed when compared to the 3.10 kernel. We’d thought we were in the clear because we did all our initial testing on clusters with SSDs. The random write regression appeared only on all-NVMe platforms, where the total IOPS are much higher: 45K (SSD) compared to 120K (NVMe). Unlike the latency spikes, we could reproduce this problem with perf_test, our internal Stargate load generator. The issue was clearly in Stargate.
The test run above was on a single node for 1 minute. Because the working set was small, our replicated, log-based datastore (oplog) completely absorbed the workload. The oplog acts as a staging area for bursty random writes that later drain into their final resting location. The following diagram shows where the oplog sits in the data path.

We needed to figure out why the oplog was slower on version 5.10 than on 3.10.
Testbed layout
In order to understand the issue completely, let’s first look at the disk layout on an all-NVME cluster. Because we care about the oplog’s performance, we should review the oplog disk selection policy:
- If any NVMe devices are present, put the oplog only on NVMe.
- Use a maximum of 12 disks for the oplog.
On an all-NVMe cluster with 8 NVMe disks, we have 2 boot disks (ext4) and 6 disks attached via Storage Performance Development Kit (SPDK). In the following picture, the boot disks perform I/O through the kernel-provided system call API (the “Original Method” side). The non-boot disks avoid the kernel entirely with SPDK (the “BlockStore + SPDK” side). The BlockStore with SPDK path delivers much lower latency and better performance than ext4-managed disks.

Various Experiments
Initially, we suspected that somehow SPDK performance was slower on version 5.10 than it was on 3.10. This assumption led to various experiments with epoll settings, Stargate’s SPDK tunables, and various patches, none of which helped. Our next test was to use an internal tool to attach a raw NVMe disk via SPDK and run a specified workload without Stargate, to see if there was a regression. When we ran this test on the same physical disk, we didn’t find a difference between the 3.10 and 5.10 kernels. However, we did find variations in performance between disks. As a result, all comparative measurements had to be on the same physical disk and same cluster.
Because SPDK wasn’t inherently slower on 5.10, we decided to try limiting the oplog to just the SPDK disks. With this change, the performance was basically the same!
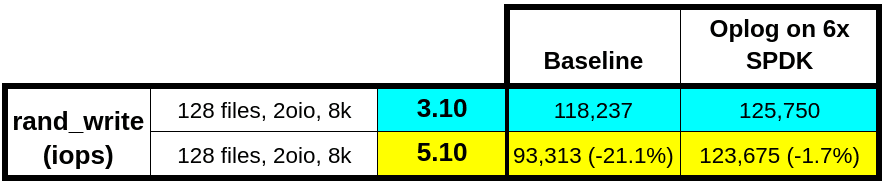
An interesting finding from this experiment is that the 3.10 performance also improved. Nutanix plans to incorporate this improvement in an upcoming AOS release. For 6 NVMe devices, it’s clear that the low latency and bandwidth of the SPDK-attached disks were more than enough to meet the oplog requirements. In fact, having the oplog on the boot disks was hindering our performance. We initially thought of limiting the oplog to SPDK disks as a solution to the regression, but this change wasn’t possible for all platforms. In configurations with 4 NVMe devices, confining the oplog to only 2 NVMe devices wouldn’t let us achieve maximum throughput. We needed to figure out the root cause.
Root Cause
With the oplog-on-all-disks configuration, we ran perf_test and saw in the top command output that kernel threads (kworker/<cpu>) were consuming nontrivial amounts of CPU. The kernel uses kworker threads to do any and all work the kernel requires. One nice thing about version 5.10 compared to 3.10 is that the kernel appends the work the thread is currently doing to the name of the kworker threads which aids in debugging.
We noticed during the random_write workload that the kworker/<cpu>-dio threads were higher up in the top -H output and doing a nontrivial amount of work. Digging into the kernel code, we determined that the dio work is direct-io.
16888 nutanix  -11   0   84.3g 154216 115448 S 19.1  0.2   0:07.45 oplog_disk_81
16880 nutanix  -11   0   84.3g 154216 115448 S 16.5  0.2   0:07.57 oplog_disk_65
16886 nutanix  -11   0   84.3g 154216 115448 S 16.2  0.2   0:07.01 oplog_disk_77
16884 nutanix  -11   0   84.3g 154216 115448 S 15.8  0.2   0:07.27 oplog_disk_73
16890 nutanix  -11   0   84.3g 154216 115448 S 15.8  0.2   0:06.99 oplog_disk_85
16892 nutanix  -11   0   84.3g 154216 115448 R 15.8  0.2   0:07.50 oplog_disk_88
...
6586 root 20   0   0  0  0 I  0.7  0.0   0:00.26 kworker/4:0-dio
12022 root 20   0   0  0  0 I  0.7  0.0   0:00.22 kworker/5:2-dio
28054 root 20   0   0  0  0 I  0.7  0.0   0:00.13 kworker/2:1-dio
This problem was now starting to make perfect sense. As we discussed with the latency spike issue, we have various Nutanix services that run as RT. In particular, Stargate runs on the greatest number of CPUs. We also have the oplog running on ext4 boot disks. The oplog issues direct-io writes, which in turn cause kworker threads to have direct-io work. If the kworker thread picked for the direct-io work is on a CPU where Stargate is running, the scheduler has to balance the RT Stargate usage with the normal priority of the kworker threads.
The result is that the system prioritizes the kworker threads behind the RT Stargate work. Thus, Stargate generates the kernel direct-io work, but Stargate also prevents that work from being executed, leading to lower performance for the ext4 disks. On the other hand, SPDK disks were unaffected because all the work for submitting I/O to the disk is handled within the Stargate process, so it never enters the kernel and never needs to be scheduled.
To test this idea, we manually went through and changed the priority for all kworker threads to be the same as Stargate. With this change, the performance got back to the 3.10 level . . . but only sometimes.
We realized that the kworker threads are ephemeral. They not only come and go but also do different work over time. So while manually changing their priority worked for a short period, it wasn’t a long-term solution. We also couldn’t have an infra service on the CVM configure this value at runtime. We would need some kernel-level modification to change the scheduling policy and the priority. As a result, we created a kernel patch to make all kernel-generated worker threads RT with the same priority as Stargate.
commit 2991f4fd2aa83e4974988812f7304ebedfe80e94 (HEAD -> master)
Author: Harshit Agarwal <harshit.agarwal@nutanix.com>
Date: Thu Aug 26 22:09:11 2021 +0000
Assigning RR RT scheduling policy with priority 10 to kernel threads
diff --git a/kernel/kthread.c b/kernel/kthread.c
index 36be4364b313..442f90975964 100644
--- a/kernel/kthread.c
+++ b/kernel/kthread.c
@@ -370,7 +370,7 @@ struct task_struct *__kthread_create_on_node(int (*threadfn)(void *data),
}
task = create->result;
if (!IS_ERR(task)) {
- static const struct sched_param param = { .sched_priority = 0 };
+ static const struct sched_param param = { .sched_priority = 10 };
char name[TASK_COMM_LEN];
/*
@@ -383,7 +383,7 @@ struct task_struct *__kthread_create_on_node(int (*threadfn)(void *data),
* root may have changed our (kthreadd's) priority or CPU mask.
* The kernel thread should not inherit these properties.
*/
- sched_setscheduler_nocheck(task, SCHED_NORMAL, ¶m);
+ sched_setscheduler_nocheck(task, SCHED_RR, ¶m);
set_cpus_allowed_ptr(task,
housekeeping_cpumask(HK_FLAG_KTHREAD));
}
~This patch also fixes the previously discussed latency spike problem. This one kernel patch sets all the ksoftirqd, kworker, and other kernel threads to be RT with the desired priority. The Nutanix performance team has vetted the fix through a full set of regression tests.
Closing thoughts
There is a common theme across all the performance issues we encountered during the 5.10 kernel qualification: they all were related to RT scheduling. In version 3.10, a user task with RT priority doesn’t starve a thread performing any sort of kernel work. The kernel thread seems to be treated with equal, if not higher, priority than the competing RT user task. Even though the top and chrt command outputs confirm that there are no scheduling configuration changes for kernel threads between versions 3.10 and 5.10, they clearly behave differently across these two kernels. In fact, the 5.10 behavior is what we should ideally expect, as these kernel threads use the default scheduling policy.
Looking closely into the kernel scheduling changes, it’s apparent that the kernel wants the user to dictate all the scheduling policies as soon as it starts running an RT task. It can’t make the correct decision itself, as it lacks the relevant information it needs. Even though the primary reason we increased the priority of kthreads was performance, it’s possible that in time we could have discovered some other starved kernel task that may have been not only more difficult to detect but to debug as well.
Finding out exactly what is different about kernel thread handling in the scheduler remains future work. Another approach we want to explore is to eliminate RT scheduling policy for Nutanix data services altogether and instead use scheduler nice-levels to dictate the priorities among services.