

Disaster Recovery is hard. Offering it as a managed service offering is harder. It also happens to be the first managed service offering from Nutanix. We have been able to do it successfully for 3+ years now with a growing customer base and multiple data centers across geographies. Multiple cross-functional teams at Nutanix work in tandem to make this happen. We have had our own roadblocks, challenges, learnings and improvements during the course. Continuous identification of tooling and process gaps, leveraging automation, focus on operations – rinse & repeat, is what has helped us to manage it successfully.
Nutanix has offered Disaster Recovery (DR) solutions for Business Continuity Planning (BCP) since the early days of the product and is an integral part of the Nutanix NCI architecture. Setting up Disaster Recovery is both simplex and complex:
- Setting up protection of workloads running on the Nutanix NCI platform is simple and intuitive, by setting up one or more secondary (failover) sites.
- Setting up and managing a secondary physical site is complex and incurs significant capital expenditure (CapEx), especially for smaller businesses.
To cater to the SMB/SME segment, Nutanix offers DR as a Service (DRaaS) in the Nutanix Cloud, where customers can subscribe to this service and leverage Nutanix-managed datacenters to set up their DR environment rather than managing their own data centers. This is typically seen as a significant CapEx→ OpEx shift.
In this blog, we’re going to talk about some of the challenges and aspirations of building the Nutanix DRaaS offering, and how we achieved it.
Challenge #1: Offering a seamless, non-disruptive experience to check DR readiness
Have you ever participated in a mock fire drill for a building?
As much of a hassle as it might seem, it has proven to be a lifesaver many-a-times during a real unfortunate event. Preparing for it, logistics, and communications, etc. requires months of preparation and planning for the personnel managing it.
For IT operations though, we wanted to make it simple. As simple as a single click!
So, what did we do?
We built non-disruptive DR validation as a feature in our DR solution called Test Failover. In DRaaS, our customers can validate their DR readiness at any point of time without touching their production environment. And it is more than a mock-drill – network, security policies and virtual machines (VM) – all come up live in our DCs in an isolated network bubble. Customers can validate their applications running live in the Nutanix Cloudand also print a report for auditing purposes.
To take it to the next level, we are building ATFO – Automated Test Fail Over where the customers can schedule Test Failovers at periodic intervals. Test Failover will automatically get triggered at those intervals and customers can review the reports later on.
Challenge #2: Early detection of product issues
As it typically happens in the early stages of Software Development Life cycle, we started with a single stage qualification method. It took more than two weeks to complete one full round of qualification for a given release (pre-GA) on pre-production environments. The cycle would repeat for every release candidate (RC) build (so typically 4-5 iterations). Post GA of the final RC build, production environments were upgraded.
Quite often we uncovered product issues much later in the cycle in pre-production and sometimes in the production environments. We wanted to streamline our qualification process and detect issues as early as possible.
So, what did we do?
We refined and re-refined our qualification process to:
- Set up a multi-stage continuous testing pipeline
- Set up a recurring feedback loop with multiple cross-functional service development teams to help identify and address product quality issues and efficiency improvements
- Set up tools and processes in place for continuous monitoring and notify customers proactively
The following sections provide more details into each of these areas.
Multi-Stage Continuous Testing
To improve the quality of the product we designed our testing environment into three different stages which helped us to identify the bugs early in the cycle before they are encountered in customer systems.
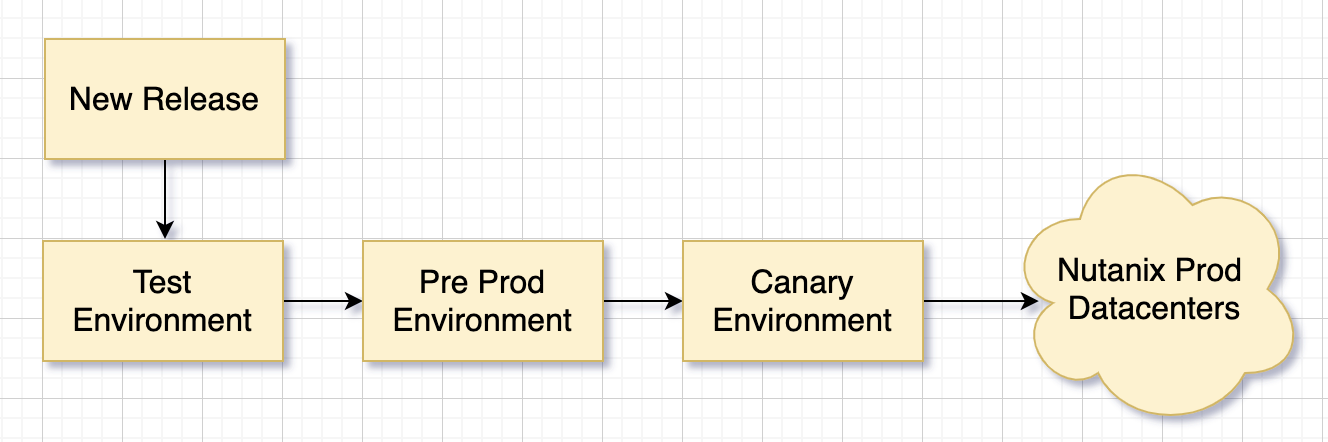
- Test environment: Here, we deployed dev verified builds and ran a large number of automated tests on a daily basis to ensure no functional and compatibility issues get escaped to the pre-production environment.
- Pre-production environment: Here, we deployed a test-environment-qualified RC build and triggered a smaller number of ~80 automated integration tests. These tests covered end-to-end customer workflows – from onboarding a new customer to core DR workflows (failover, failback, metering, billing) which customers execute in their environment. This ensured an exhaustive coverage of multiple services working together. Additionally, we focussed on:.
- Scale: We simulated a typical customer profile in terms of scale with about 150-200 VMs (CentOS/Windows) for test/planned/unplanned failover.
- Coverage:
- We simulated different workloads
- Windows workloads
- CentOS workloads
- Different network configurations
- Having Nutanix or Palo Alto VPN on the on-prem side to establish the communication
- Having BGP or Static routes to publish the subnet routes
- We simulated different workloads
- Execution time: We examined the tests as well as the framework and redesigned them to enable parallel execution against the same testbeds without compromising on debuggability and reporting. This helped us reduce the turnaround time from about two weeks to 3-4 days for one full round of execution.
- Production environment: Prior to upgrading the full DC, we wanted some soak time for GA builds specifically to identify issues with long running testbeds. For this, we set up a dedicated Canary tenant in each datacenter (DC). GA builds were first loaded on these long running Canary tenants which mimic the customer environments with different workloads and different network configurations. We exercise a larger scale here with upto 600 VMs (CentOS/Windows) and run a smaller sub-set of ~20 P0 tests on this environment. Any new release gets soaked for more than a week in the Canary environment. With all the efficiency improvements we can run smoke tests on canary environments in less than 24 hrs now. If we do not see any issues during our canary qualification we promote the release to Production Data Centers.
Product quality issues and efficiency improvements
No software can be entirely bug free, but we should find and fix bugs early on before it affects the customer’s environment. For instance, Nutanix DR-as-a-Service supports one minute RPO with our NearSync technology, so even if we miss one replication, it is a bad customer experience.
How did we achieve more than 99% of the success rate? We started doing RCA of every bug filed during the testing phase. If it affects the functionality or just user experience, we start fixing those bugs during that release cycle itself so they can be pushed to production in a timely manner. When we find any CFD, which can come directly from the customer or by our analysis of every failure in the customer environment, we started digging them thoroughly by finding an RCA and assessing them on why we could not find them in the test environment. We analyze these test gaps and make continuous changes in our test plan to identify the issues in the test environment itself and the result is here with better quality/efficiency on successful execution of DRaaS workflows.

The above chart shows the improvements made over the last one year on the DRaaS executions (Test/Planned/Unplanned, failover) made by our customers. In the last two months we had 98% (January) and 99% (February) successful executions. The blue line in the above graph is the trend line which shows that we are consistently improving our quality over the last one year.
CFDs resolution for last one and half years
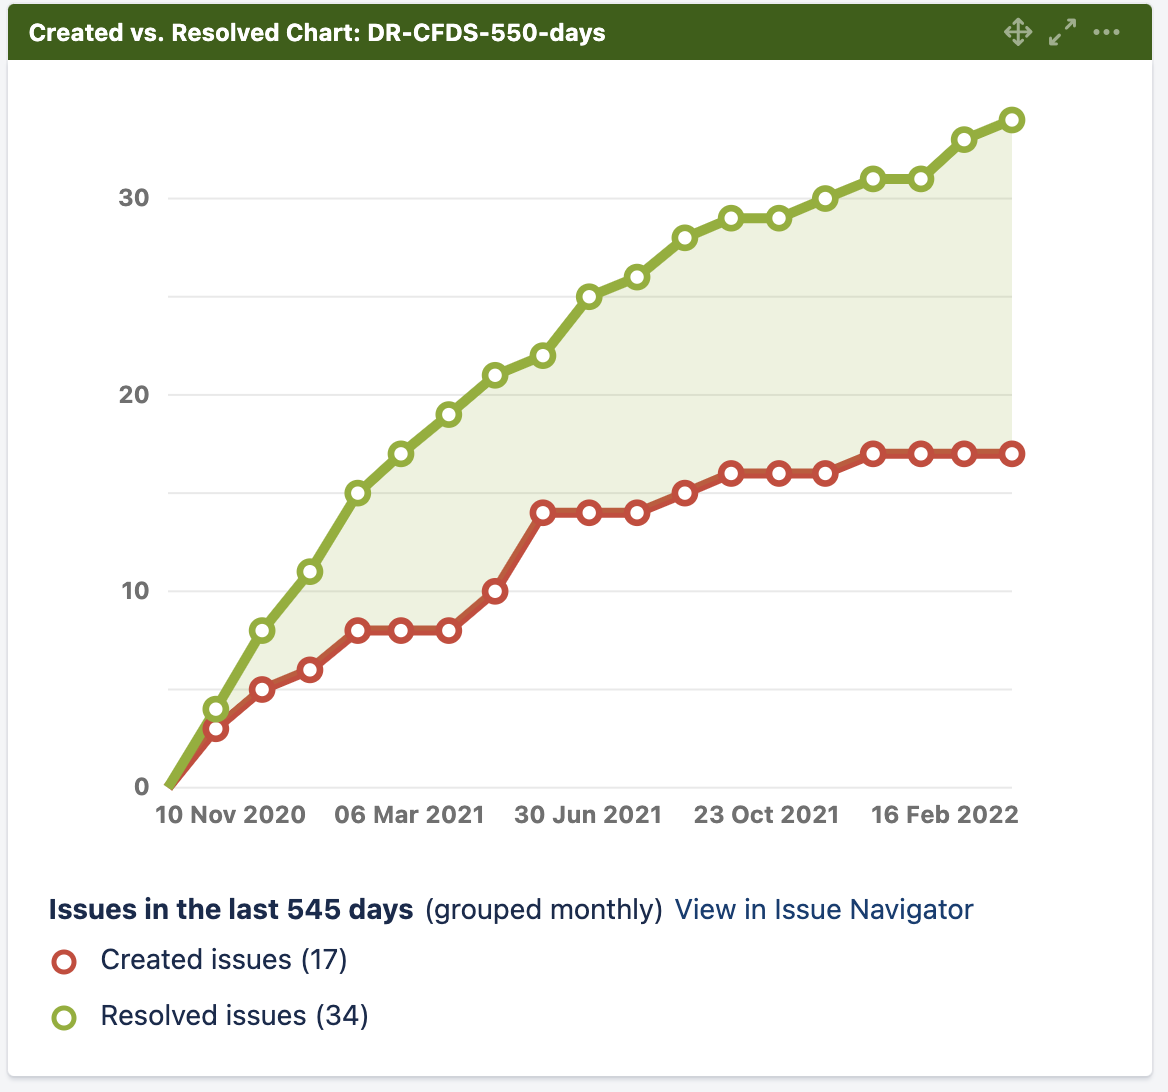
The above Jira chart shows the CFDs Created vs Resolved rate for a period of last one and half years. We found 17 CFDs and at the same time we resolved overall 34 CFDs in this time frame, including some of the older CFDs. Our CFDs incoming rate reduced gradually as we stabilized our product.
Customer Communication
Gaining the trust and confidence from customers for a fully managed software product requires transparency and continuous communication to the customers. Nutanix has an NPS score of more than 90, our self monitoring system is able to identify the issues be it config issues on the environment or product issues, tickets get created automatically before even customers reach out to us. Whenever we find any CFDs or config issues, we inform customers upfront and we proactively work with them to either resolve configuration issues or provide a workaround to resolve the product issue. Once we identified the issue as a CFD, there are chances that the same issues can happen in other customer environments as well. To help the other customers we started writing KBs which includes all the details about the issue and how to resolve them. This comes in handy for the customers as well as for the support team to resolve the issues soon.
Challenge #3: Early detection of issues in the production environment
Nutanix DRaaS is a hybrid cloud service. The underlying infrastructure and operational services are also distributed across clouds and there can be multiple points of failure resulting in a bad customer experience. Customers do expect DR solutions to work all the time and it is very critical from a business continuity perspective.
So, what did we do?
Since this is a completely managed service we made sure that we have enough telemetry in place. So, we set up a telemetry platform, identified different points of failure, enabled telemetry and monitoring on the pre-production and production environments. To ensure we have eyes on it all the time, we set up a team of SRE experts. We set up automated alerts in place and established an on-call process to handle escalations 24 by 7. Any failure in the system (unless auto-restored) will generate an incident that will be looked into. We established KPIs around this and conducted monthly business reviews (MBR) to ensure we track them on an ongoing basis and keep refining our tooling and process to make these environments more stable and robust.
As a result, we have improved the reliability and quality of our DR solution with a success rate of more than 99% for customers performing any type of failover at any point of time.
What’s Next?
At Nutanix, we always strive to deliver the highest quality products for delightful customer experiences. Now we have set the strong ground and we would like to bring in a whole new set of workloads to our testing environments to run against Windows 2016/2020 servers with SQL/Outlook workloads actively along with replicating Tens of TB of data from onprem to remote site. Focus more on Cross Hypervisor use cases (VMware vSphere on-prem) as well with different Windows workloads. We have set ourselves a target of reducing the CFDs to less than 2 per quarter and strive to improve our quality with an aim to have 100% success for our customer executions.