

Introduction
You got the Power! And a bill … and carbon emissions targets … on power consumption, PUE and data center modernisation.
With the global ICT industry now rivalling the aviation industry for carbon emissions(3) and electricity costs still sky high in Europe and elsewhere due to the ongoing energy crisis, IT is once again being pushed to drive further efficiencies. As always, “if you can’t measure it, you can’t improve it” and PUE (Power Usage Effectiveness) has been the defacto industry standard measurement of datacenter efficiency. But PUE isn’t everything. What’s more, some people are beginning to suggest that PUE has outlived its usefulness and its evolution from internal optimization metric to marketing tool has diminished its value. Regardless, at least conceptually, PUE remains a useful way to understand the power consumption of a data center facility. This article examines how PUE might be affected by changing power demand associated with storage, compute and network equipment modernisation and discusses the implications.
The Nutanix approach to energy efficiency is to reduce the power required at the rack through its Hyper Converged Infrastructure (Nutanix Cloud Infrastructure) technologies and through various other easy to use features including those that are part of Nutanix Cloud Manager (NCM). Although using Nutanix solutions may indirectly have a positive effect on your facility’s PUE in some scenarios, typically the outcome is to reduce the power requirement at the rack rather than directly improving your PUE score. Before we work this through with an example let’s just level set on what PUE is:
PUE = Total Datacenter Power Consumption / Power consumption of IT equipmentAccording to various studies, the average PUE is roughly in the region of 1.5 (see note below). As an example, a PUE of 1.5 indicates that for every 1 kilowatt of IT power used, 0.5 kilowatt is used for cooling, lighting, HVAC and other non-IT functions.
Sounds simple, but how about a diagram?
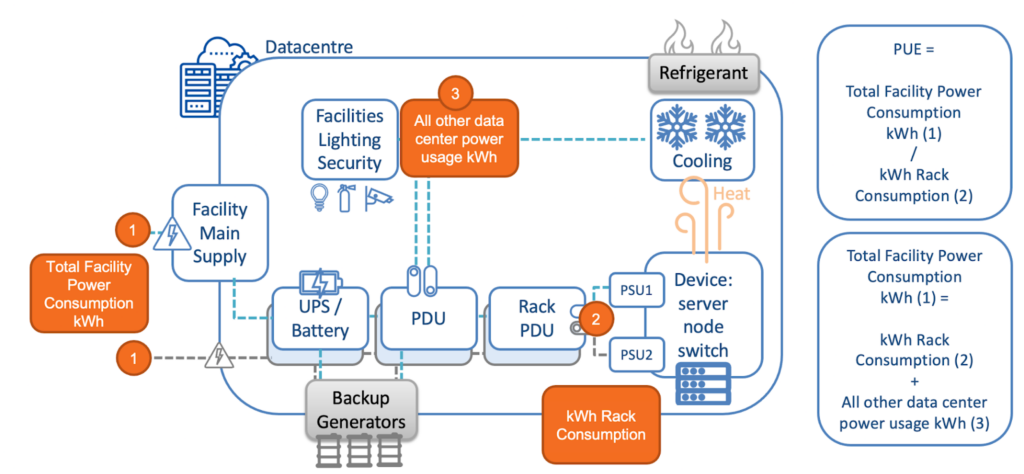
In this diagram, you can see that you (in theory at least) only need to know the following to calculate the PUE of the facility.
- (1) Total Facility Power Consumption kWh
- (2) Rack Consumption Power consumption kWh
In addition:
- (3) All other data center power usage to demonstrate where all the other power required to run a facility goes.
That power (3) goes to uses including lighting, cooling, HVAC and other non-IT systems potentially down to such detail as the vending machines in a breakout room or the security guards’ coffee machine. As Rack Consumption (2) is part of the Total Facility consumption (1) the PUE can never be less than 1 unless somehow the heat from the servers is used to generate more power … but that’s not something that’s really happening right now.
Your organization’s facility may also include office space or other power consumers that are not part of the day-to-day datacenter operations and typically you would not include these in PUE calculations. Having the right metering in place to be able to separate out the non datacenter usage can be a challenge for some mixed use facilities. Estimates may have to be used or you could consider investing in some additional metering equipment that doesn’t have to be invasive or bank breakingly expensive (largely thanks to recent advances in IoT equipment although IoT is beyond the scope of today’s article). Whatever your situation, the important thing is to start now and try to create a baseline, identifying gaps and areas of usage as best you can.
How about an example?
A customer, “Biggin Corp”, has a datacenter with 100kW of IT equipment in their racks, measured at the rack, and their datacenter overall consumes 250kW, metered at the entry point and/or by the power company. Therefore:
250kW (at the DC) / 100kW (at the Rack) = PUE 2.5Also, 250kW – 100kW Rack Power = 150kW of other power consumption in the datacenter. These can include cooling, physical security and tea making facilities as depicted by (3) in the above diagram.
So far, so straight forward. Although not a super efficient site, at least they know where they stand!
The 150kW of that overall DC usage that isn’t powering IT equipment at the rack goes towards various datacenter functions. As mentioned above, these can include lighting, environmental controls (cooling in particular), security & management systems, efficiency of power distribution, uninterruptible power supplies (UPS) and other factors, even down to the security guards’ kettle! They all add up and all contribute to the datacenter overhead that factors into the facility’s PUE. The majority is often the cooling of the physical servers but the other factors are not always insignificant.
If Biggin Corp were to modernize their IT infrastructure in the racks with Nutanix Hyper Converged Infrastructure (HCI), they could quite conceivably reduce the power consumed at the rack by 50% to 50kW, without a reduction in capacity, performance or availability. It’s likely that the same or similar physical security, lighting, management systems, etc. are still required to roughly the same level to operate the facility so for this example we’ll assume they remain constant.
The reduction in footprint/power consumed at the rack would likely reduce the power required for cooling but the outcome of this could vary greatly depending on the cooling technology used and its ability to adapt to a new heat profile. Just because there’s less power being consumed at the rack level, and fewer BTUs of heat being created, it doesn’t mean the power consumed by the cooling systems is going to reduce proportionately. The reduction will depend on the flexibility and efficiency of the cooling systems employed as well as a variety of other factors. For simplicity’s sake, we’ll optimistically assume that the facility is fairly modern and flexible so in this example save a watt on cooling for every watt we save at the rack.
And now the numbers, assuming a 50kW saving from reduced cooling and perhaps other reductions:
- New power at rack: 50kW
- New power required to run the facility: 100kW
The Results
- New overall DC power consumption: 150kW
- New PUE: (50 + 100) / 50 = 3
As you can see, the overall DC and rack power consumption has reduced which is great! But as a result, the calculation shows the PUE has gone up so Biggin’s data center is fulfilling the reduced workload power requirement less efficiently than when they were fulfilling the larger power requirement. To help visualize this, here are some bar charts to demonstrate the scenarios:
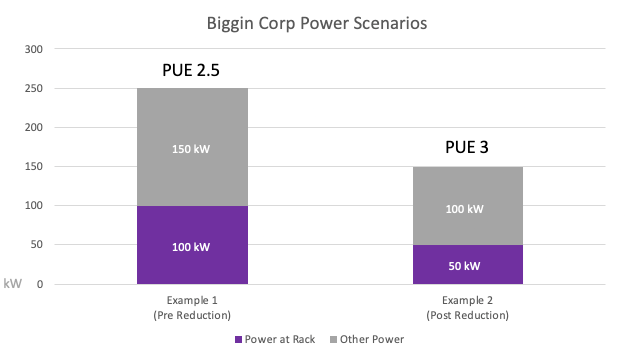
So the data center is doing the same job, providing the same storage and compute services, but the reduced power requirement means the PUE goes up. It’s just math!
Now that Biggin Corp understands how much kit is in the racks they need to power and cool (etc.) they can start effectively implementing strategies for improving the efficiency of their datacenter in delivering power to the rack i.e. things that will affect the PUE. But if, for argument’s sake, they just wanted to improve the PUE, they could add a couple of electric heaters to their rack and cool them. That would be pretty straight forward but that wouldn’t be very good for either their electricity bill or the environment!
Some better approaches might be:
- Looking at hot/cold aisle containment
- Improved cooling technologies
- More efficient UPS
- Addressing lighting and other aspects of running their facility that would improve the efficiency of the power delivered to the rack
- Other considerations for optimizing the consumption of resources such as:
- VM rightsizing
- Seasonal scaling
- Cloud bursting
- Pilot light DR
- Chargeback/showback to reduce the demand
- Turning off infrastructure where they can, but have it ready to turn on when they need it
Once they have established what their IT footprint looks like within the rack, it then follows that they can more optimally implement strategies for delivering power/cooling to the rack. For example, had they decided to buy a new Uninterruptible Power Supply (UPS) for their previous workload, they’d have needed a UPS at least double the size than they did after their modernisation program. That’s a waste of money, a lot more embedded emissions and probably not as efficient as implementing a UPS that is correctly sized.
The numbers used here are only by way of an example and you might consider that cooling reduction vs power reduced at the rack might play differently in your facility. By way of a counter example, if you are taking advantage of a co-location facility that serves hundreds of customers who all have different technologies in their racks, it’s unlikely that your optimizations in the rack will make any measurable difference to that facility’s PUE at all. I also have experience of visiting a new datacenter facility many years ago that was less than an eighth occupied in its main data hall. They had installed portable gas heaters because their cooling could not deal with such a low heat generation. Ok, they weren’t using any more electricity in that case, but in order to prevent issues with the cooling system they needed to warm the place up by burning gas!
Conclusion
In either of the “Biggin Corp” scenarios, an important point to note is that implementing HCI or any other modern infrastructure platform, whilst reducing power consumption requirements at the rack, and therefore overall for the data center, might not directly improve your datacenter’s PUE, but it can make it more efficient at delivering compute and storage services.
So whilst it’s still likely to be useful as an internal improvement metric, PUE really isn’t that helpful when it comes to making outside comparisons, which was never the intention of PUE’s creators anyway. It can still be very helpful from a conceptual or educational point of view to help our understanding of datacenters and their efficiency. But we should take care when comparing claimed figures from different suppliers, especially as the PUEs tend towards 1 and the differences become more marginal.
Perhaps more importantly, making the changes at the rack and implementing efficient technologies first so that the datacenter can be designed to optimally support those modern power/cooling requirements is most likely the optimal approach. Otherwise the reduction in IT infrastructure and improved density could result in a datacenter not designed for the workload it is hosting and therefore not performing as efficiently as it could.
Modern datacenter designs are done with this in mind and can dramatically reduce the overall facility power consumption, in some cases taking the PUE down to near or even below 1.1 if the newest methods and technologies are applied. This can be retro-fitted into existing buildings, or it can be delivered pre-built by using co-location providers or containerised datacenter providers. With recent advances in power management, monitoring and IoT devices, datacenters have come a long way and it could be time to take a look at updating yours. But taking care of what’s in the rack should probably take priority as this will achieve the most direct outcomes.
Addendum
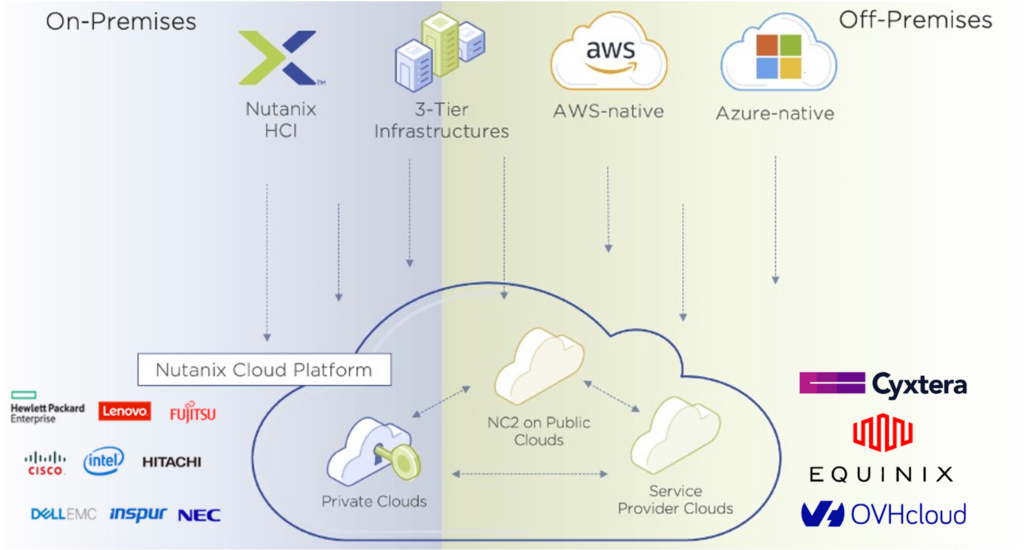
In addition to the reductions in power, cooling, rack space and manual effort, another reason that the Nutanix Cloud Platform (NCP) is a great choice for datacenter modernization is its flexibility. In particular, 4 factors stand out for a customer like Biggin Corp:
- Easy to deploy and highly scalable both up and down
- Runs across a range of hardware and bare metal platforms including public cloud
- Portable, subscription based licensing means you can take it where you need it
- A single, highly automated platform for all storage & app needs:
- Block
- File
- Object
- Database
- Containers
These factors combined mean that as you take on a datacenter modernisation programme, Nutanix Cloud Platform is a choice that not only reduces power, facility and management overheads, but also protects your investment across a range of use cases and platforms by facilitating the mobility of your applications and allowing the licenses to move with your workloads.
In our example above, a workload running on Nutanix in Biggin Corp’s data center could then be more easily moved to a co-location provider or public cloud using Nutanix Cloud Clusters (NC2). This could mean a much reduced PUE or to a region with cheaper or less carbon-intensive electricity. Then, as the workloads increase at the target location, the source cluster can be scaled down or re-used and the Nutanix licenses move with the workload, providing a very flexible and portable platform to cost-effectively move applications between datacenters, collocations and clouds.
However your modernisation programme progresses, or wherever your workloads end up, the Nutanix Cloud Platform has the power to not only modernize and optimize in place, but also to facilitate the move to a more optimal location as required by your application and business needs.
References
Estimations of amount of DC power required for cooling:
- “United States Data Center Energy Usage Report” by Lawrence Berkeley National Laboratory
- “Is PUE too long in the tooth?” – Dane Swinhoe
- “Emissions from computing and ICT could be worse than previously thought” – Lancaster University
On Average PUE
We’ve used 1.5 in the first example because it’s easy to see how the numbers work and roughly near the figures we’ve sourced below. Remember that any average of datacenters’ PUE will likely be skewed by a large number of super efficiently-run hyperscale data centers run by the likes of Amazon, Apple, Microsoft, Google etc. and very efficient co-locations run by Equinix, Cyxterra and others. Most organizations running their own datacenters don’t get near this or are not really in a position to effectively measure their power usage.
With the Biggin corp example we’ve used 2.5 as it is a) easier for the math, but also b) because of the above skewing due to the efficiency of the hyperscale/colocation datacenters.
Here is a sourced list of hyperscaler PUEs for reference:
| Company Name | PUE | Source |
|---|---|---|
| OVHcloud | 1.09 | https://www.ovhcloud.com/en/about-us/our-responsibility/environment/pue/ |
| Microsoft Azure | 1.12 | https://docs.microsoft.com/en-us/azure/architecture/topics/green-datacenter-design/power-efficiency |
| Google Cloud Platform | 1.12 | https://cloud.google.com/sustainability/data-centers#data-center-power-usage-effectiveness-pue |
| Amazon Web Services | 1.2 | https://aws.amazon.com/about-aws/sustainability/data-centers/ |
| Oracle Cloud Infrastructure | 1.2 | https://www.oracle.com/corporate/citizenship/sustainability/reporting/data-center.html |
| Tencent Cloud | 1.2 | https://intl.cloud.tencent.com/document/product/213/1370 |
| Salesforce | 1.22 | https://www.salesforce.com/company/sustainability/data-centers/ |
| Alibaba Cloud | 1.21 | https://www.alibabacloud.com/help/doc-detail/54736.htm |
| Dataqube | 1.35 | https://www.dataqube.global/ |
| IBM Cloud | 1.45 | https://www.ibm.com/cloud/data-centers |
How and how often these are calculated may change as there are no hard and fast methodologies or rules for how it’s done. It’s also rare that they are audited by 3rd parties so although they are useful as a point of reference or general awareness, they are not necessarily useful for direct comparisons between providers as their measurement methodologies may vary.
My personal opinion, worrying about a PUE being different by a few % points, or even a few 10s of % points is increasingly pointless the closer they get to 1. Differing methodologies mean it’s just not a clear cut metric and actually a ratio. Even if PUE was a clear cut metric, what is in the rack is likely more important in optimizing overall data center efficiency. More so is the visibility and control you have available, so if a low PUE comes with little visibility or control then it’s probably less meaningful than one that you have complete autonomy over.