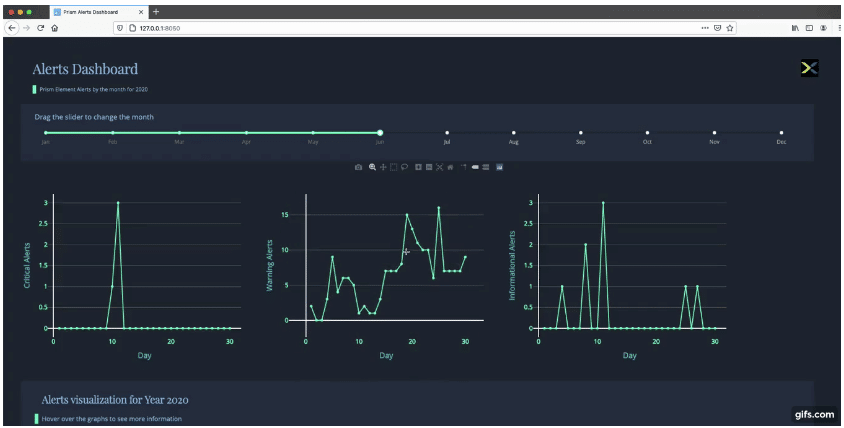
This app creates a dashboard to visualise all the alerts generated in your Nutanix cluster. You can filter out the alerts by severity levels and view them by the month as well as annually. It is meant to be an enhancement to the Analysis page in Prism in terms of data visualisation.
Code Sample Details
This section may be empty if additional code sample details are not available.